Netflix, Microsoft partner for ad supported subscription plan
Written on July 13, 2022 at 6:13 pm, by admin
Microsoft announced today that they had been selected as the new partner to help bring an ad-supported subscription plan to Netflix.
Beating Google and NBC. Last month we reported that NBCUniversal and Google had been the frontrunners, so the announcement is quite a surprise that Microsoft had been chosen. “Unlike the top three ad sellers in Google, Meta, and Amazon, Microsoft hasn’t pushed competing streaming products.” Insider Intelligence Principal Analyst Ross Benes said.
What this means. Despite growing revenues, Netflix’s share of overall OTT subscription revenues is shrinking. It had 49.1% of total US OTT subscription revenues in 2018, which is expected to fall to 29.3% by the end of this year. “This deal gives Microsoft something its growing ad business has lacked–quality streaming video inventory that has potential to scale. Microsoft, the fourth largest ad seller in the US, offers fewer conflicts of interest for Netflix than some other companies and it has strong relationships with a wide swath of advertisers.” Benes says.
What Netflix is saying.
In April we announced that we will introduce a new lower priced ad-supported subscription plan for consumers, in addition to our existing ads-free basic, standard, and premium plans. Today we are pleased to announce that we have selected Microsoft as our global advertising technology and sales partner.
Microsoft has the proven ability to support all our advertising needs as we together build a new ad-supported offering. More importantly, Microsoft offered the flexibility to innovate over time on both the technology and sales side, as well as strong privacy protections for our members.
It’s very early days and we have much to work through. But our long-term goal is clear: More choice for consumers and a premium, better-than-linear TV brand experience for advertisers. We’re excited to work with Microsoft as we bring this new service to life.
The official announcement. There isn’t much information on the partnership yet, or when the new ad-supported options will start, but you can read the official announcement from Microsoft here. We have reached out to Microsoft for a quote.
Why we care. Advertisers should benefit from additional ad placement options, especially on such a large platform such as Netflix. And those who have been sleeping on Microsoft or CTV advertising in general should jump on the opportunity ASAP.
The post Netflix, Microsoft partner for ad supported subscription plan appeared first on Search Engine Land.
Courtesy of Search Engine Land: News & Info About SEO, PPC, SEM, Search Engines & Search Marketing
Category seo news | Tags:
Social Networks : Technorati, Stumble it!, Digg, de.licio.us, Yahoo, reddit, Blogmarks, Google, Magnolia.
What is Google Data Studio and how you can use it
Written on July 13, 2022 at 6:13 pm, by admin
Analytics has always been a challenge for marketers.
Data can be confusing, overwhelming and, difficult for the ordinary human to understand and decipher.
In many cases, marketers don’t even report back their clients’ analytics and performance metrics because they’re just not sure where to start — partly because of information overload and difficult-to-understand data.
To make matters worse, for many local SMB clients, showing Google Analytics data – or any metrics data – is about as foreign as seeing an alien spacecraft.
If you’re like most agencies that do provide clients with analytics reports, it typically means laboriously downloading Google Analytics or Search Console data and putting that data into an Excel spreadsheet to create charts and diagrams from there. Or, even more painstaking, copying and pasting information from various sources into a Google or Word doc.
This means having to hobble a pieced-together report that looks anything but professional or easy to understand.
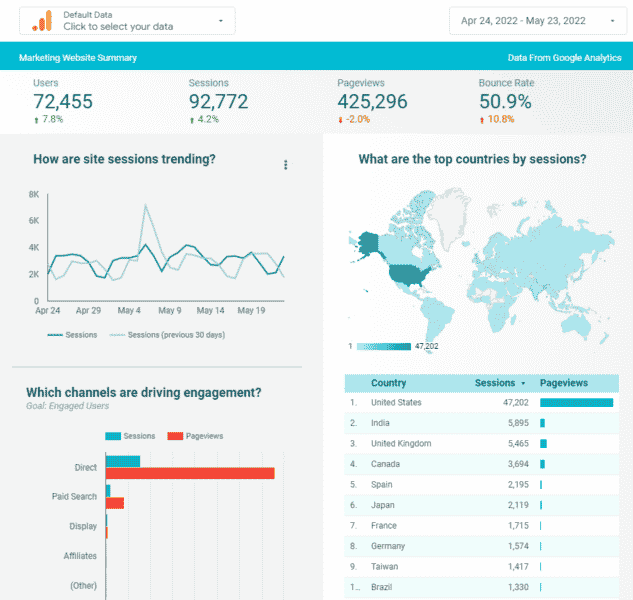
But if you use Google Data Studio, it gives you everything you need to turn your client’s analytics data into informational, easy-to-understand reports through data visualization.
Now you can finally create reports that you and your clients can understand!
What is Google Data Studio?
Data Studio is a data visualization platform that makes reports easier to create and understand.
It lets you to bring in sets of data from various places into one location so you can turn that information into an easy-to-understand report.
As a bonus, Data Studio is free to use.
When you use Data Studio, you can decide how you tell your “numbers” story to your clients.
You can do all of the following in Data Studio:
- Use graphics, tables or bar charts.
- Decide what type of numbers and data you want to share.
- Add text to explain data points or what’s displayed in the report.
- Change fonts and colors.
- Brand the report with your client’s logo.
- Add a video to explain something to your client.
The reports are easy to read, easy to share and even customizable to each of your clients.
Another thing that’s cool about Data Studio is you can pull in more than just Google data – you can import third-party data, like Facebook Ads or Insights, LinkedIn Ads or data from other sources, too.
The reports are also dynamic, so when there’s an update to the original data source, the updated/new information automatically shows up on any reports that reference that source.
Additionally, the reports are shareable, so you can grant people permission to view the reports and/or allow them to make changes – or just view the report.
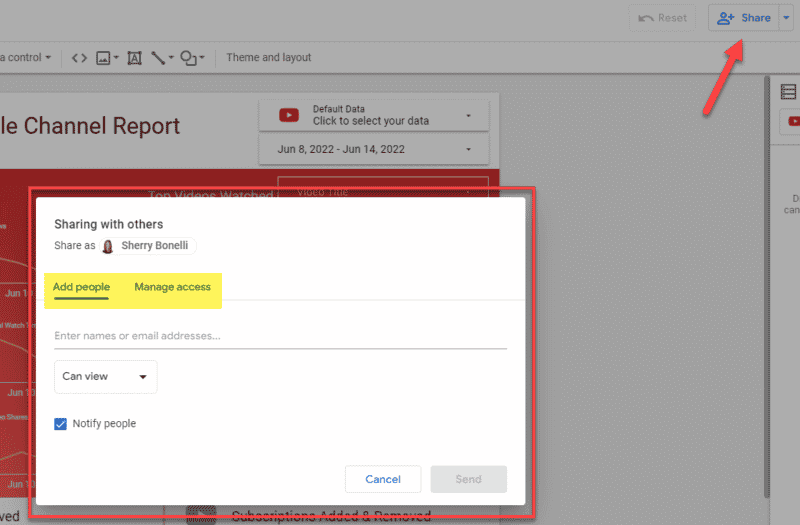
Google Data Studio uses the same functionality as Google Docs and Google Sheets, so all you need to do is press the “Share” button to let your clients or other members of your team view or edit the reports. (For clients, I recommend giving them permission to view only.)
Let’s go over the basics of Google Data Studio, the various “pieces” and how they work together.
How to access Google Data Studio
To access Google Data Studio, visit https://www.google.com/analytics/data-studio and log in using your Google Analytics login information.
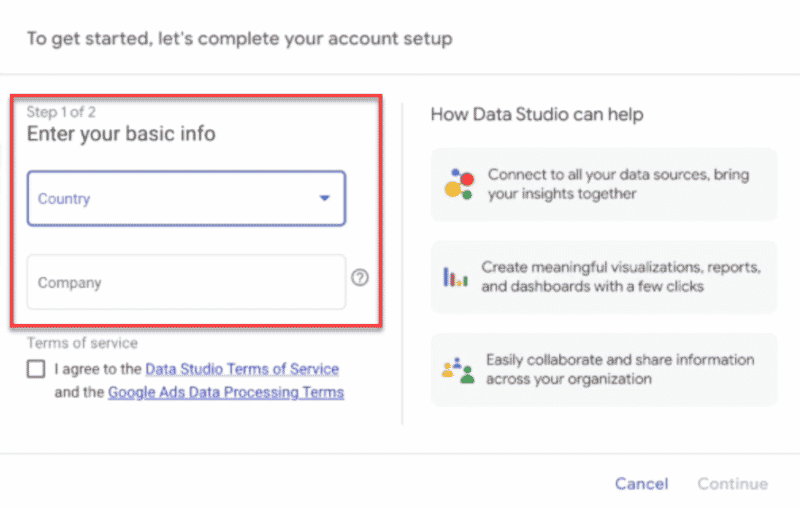
If this is your first time using Data Studio, you’ll be asked some initial questions, like your country, company name, whether you’d like to receive emails, etc.
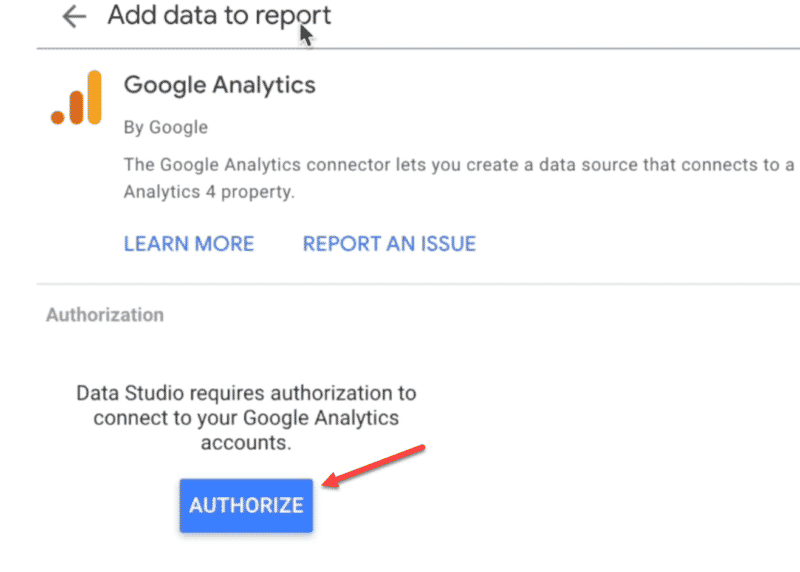
You’ll next be asked to choose a “connector.” For most people, Google Analytics will be one of the metrics you will want to show in your reports.

You’ll then be asked to authorize Google Analytics, or whatever “connector” you are adding. You will simply login, authorize and connect.
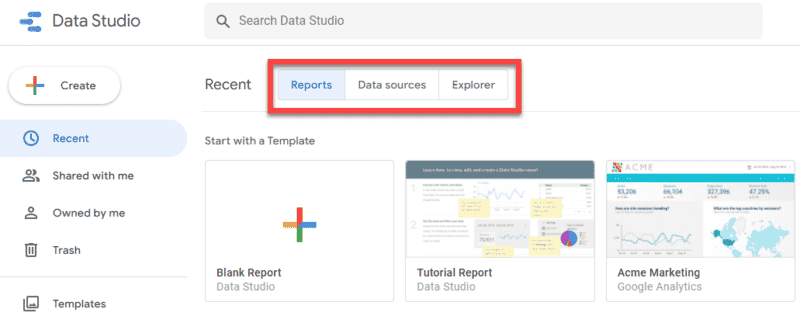
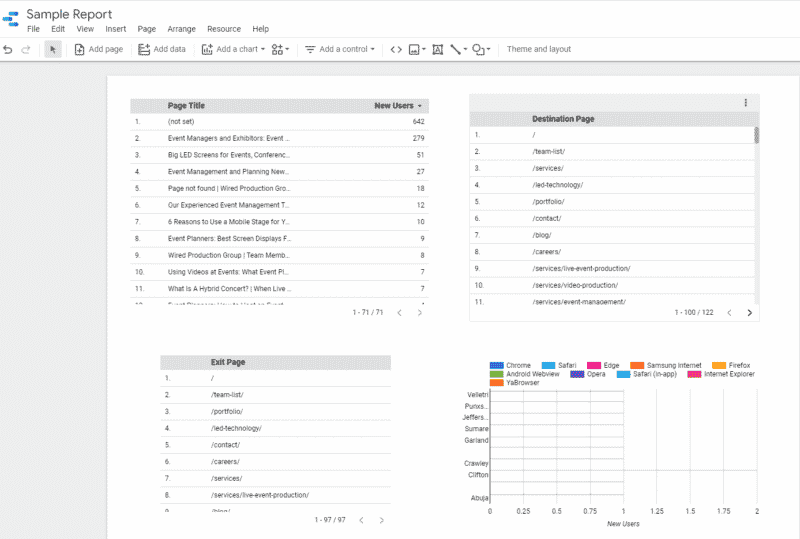
You will then be shown a blank report.
However, you will also see some sample reports/templates that give you an idea of the look and feel of the reports and the types of information you can pull into your custom reports once you get going.
New to Google Data Studio?
If you’re new to Data Studio, it’s best to go through the “Welcome to Data Studio” walkthrough. To get there, click on “Owned By Me” on the left side.

And then choose the Tutorial Report.
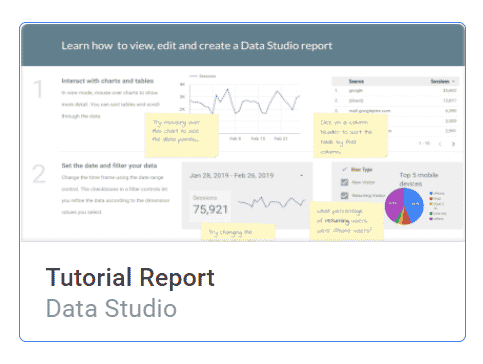
You’re then taken to a visual, interactive tutorial that will walk you step-by-step through what Data Studio can do and how to get started. Be sure to check this out.

Google also provides you with several Data Studio videos that you can watch to get overviews of the tool, gives you a walk-through on using the basics, adding data to a report, creating calculated fields and more.
Data Studio homepage overview
At the top of the homepage, you will see Reports, Data Sources and Explorer. In Reports, you can create reports and data visualizations.
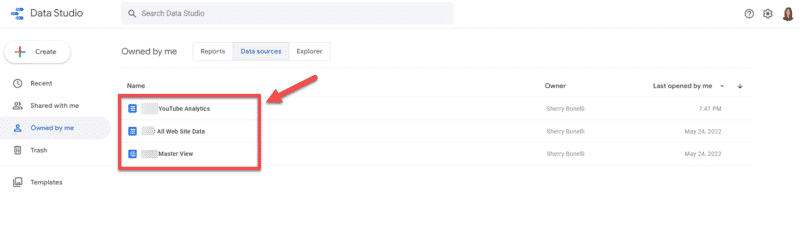
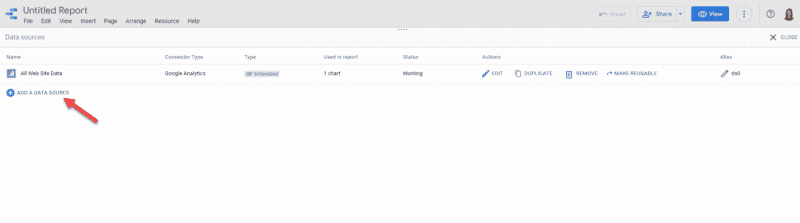
Data Sources are reusable components that connect a report to your data, such as Google Analytics, Google Sheets, Google Ads, YouTube and so forth. Once you’ve connected those sources, they will be displayed here.
Here’s an example of a connected YouTube account, so you can report on number of video shares, views, average watch time and more.

The Explorer tool is a temporary “scratchpad” where you can edit visualizations and filter data and insights.
This tool helps you find insights quicker because it streamlines the editing and viewing process and applies filters quicker.
Important: These files are temporary unless you save them.
Also, these files are private and cannot be shared directly.
However, if you’d like, you can export these reports to save and share that way.
Data Studio uses the Google Drive interface, so it’ll be familiar to you if you use any of the various Google products.
If you get lost, all you need to do is click the home button:

Help and user settings
Whenever you’re getting used to using a new tool, it’s always a good idea to know where to go if you need help.
In the upper right corner, you will find the help and settings section.

Here, you can find help documents, new features, video tutorials, report galleries, developer options, account and privacy options and more. And if you click on your smiling face, you can even manage your Google account.
What are your goals for your Data Studio reports?
Before you set up your first project, you need to decide which campaigns and channels you want to include in the reports you create.
Because Data Studio is a Google product, its best use is for gathering and reporting Google data, like Google Ads, Search Console, Google Analytics, YouTube, etc. But through the Community Connectors, you can incorporate data from other channels like Facebook ads, LinkedIn ads, Bing and other sources.
Keep in mind, however, that there is typically a fee associated with using connectors that link non-Google-related products. (But if you’re trying to streamline your reporting processes for you or your clients, it can be worth the extra expense.)
Think about your goals. What measurements are important? Is it:
- Click-through rates (CTRs)?
- Page views?
- New visitors?
- Costs?
Planning ahead is important before you start building your reports.
It’s important that you talk with your clients ahead of time to understand their definition of success so you can incorporate the right measurements, stats and data into the reports.
Yes, Data Studio reports are easy to customize and add to, but wouldn’t it be nice to get it right the first time?
Getting started with Google Data Studio reports: Selecting a report template
When you know which channels you want to include in your Data Studio report, you can get started creating your report.
You can start with a blank report or Data Studio makes many pre-made report templates available to you. These pre-made templates make it easier for anyone to create a data visualization story that looks professional – and you can still have some fun with creative formatting and customization.
The templates available provide plenty of room to customize data, colors and layout. Whether you’re developing a standard overview for a general audience who want insights into trending topics or are creating a report for a senior-level stakeholder who just wants topline stats, you can create a report that suits every stakeholder’s needs.
The Data Studio report development process is pretty straightforward. The templates available provide plenty of room to customize your data and layout.
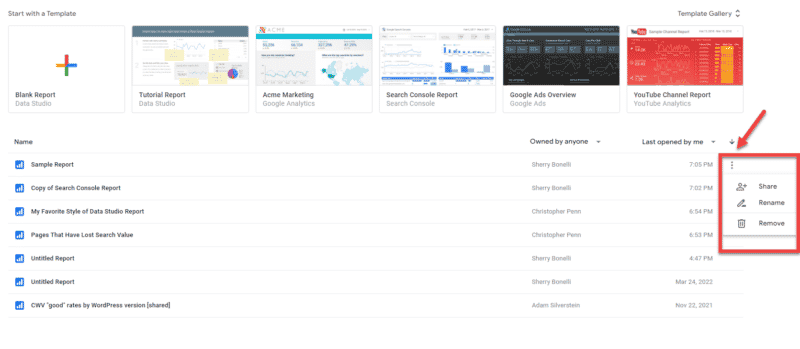
To see the templates, click on the Reports tab and then Template Gallery (on the right side.)
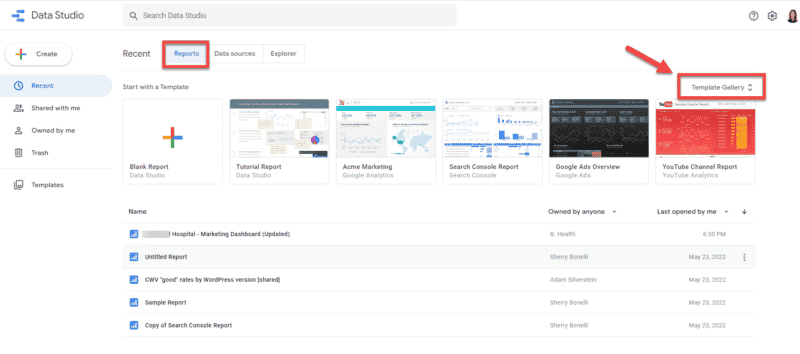
Once you’re in the Template Gallery, you’ll be taken to a slew of templates you can choose from.
You can use these templates as “starting points” for your reports. You can even choose from the categories drop-down list to help find a particular report template that suits your reporting needs best.

Choose the template that best fits your reporting needs. Keep in mind that you can customize the template as much as you’d like.

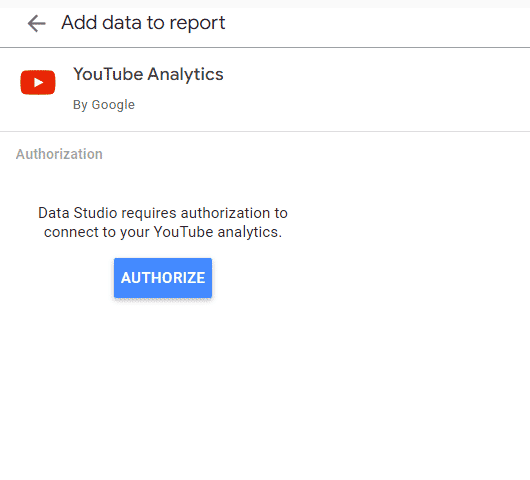
Once you choose a template, you can add your data sources. It’s easier to add Google sources because you just need to authorize Google to pull in data from the property, like YouTube, Google Analytics or Search Console, for example.
If you want to pull in third-party data, from Facebook, Twitter or Bing, for example, you need to use “Community Connectors.” As mentioned earlier, these connectors typically involve a fee, but they are invaluable if you want to pull in data and performance metrics all in one report.
From the template, select “Use my own data.”

You’ll then be asked to authorize to add the data or use a Community Connector if it’s a third-party tool.
Once the data has been successfully added, you’ll see your information populate the sample report template, and you’ll see a green checkmark next to the “Use my own data” button.

Now you can begin to customize your Data Studio report by visualizing your data with charts, graphs, tables and more.
Remember to think about who will be reading this report — what data is important to them?
Don’t overload the report with unnecessary information. Think about what story you want your report to tell.
For instance, at the top, you may want to show an “at-a-glance” table that displays the main highlights and then have more detailed stats toward the bottom.
You can also insert videos and text fields to explain what the data shows or how to read the report. You can add more than one page to your report, too.

To add data to the report, click the Edit and share button.
You will then be prompted/notified that you are about to add data to the report. Click Add To Report.

You can then start customizing the report by adding available fields, deleting items, adding charts, data, editing and more.


Again, it will take some trial and error before you get the report looking the way you want it to. But practice makes perfect when it comes to Data Studio reports.
At first, it will be all about experimenting with Data Studio, so make sure you give yourself plenty of time before your first report is due to the client.
If you want to start a report from scratch, simply click Blank Report:
![]()
And select what type of data (“connector”) you’d like to add to the report.

In this example, we’ll select Google Analytics. If you have more than one client that you manage, you’ll need to select the correct client’s Google Analytics Account and click Add.
On the right side, you will see all the data sources you can add/manage. If you want to look at these items in greater detail, choose Resources > Manage Added Data Sources and then Edit.

This displays all the different fields you can use for your reports. Click Add a Field to start adding the metrics you’d like to start measuring in your reports.
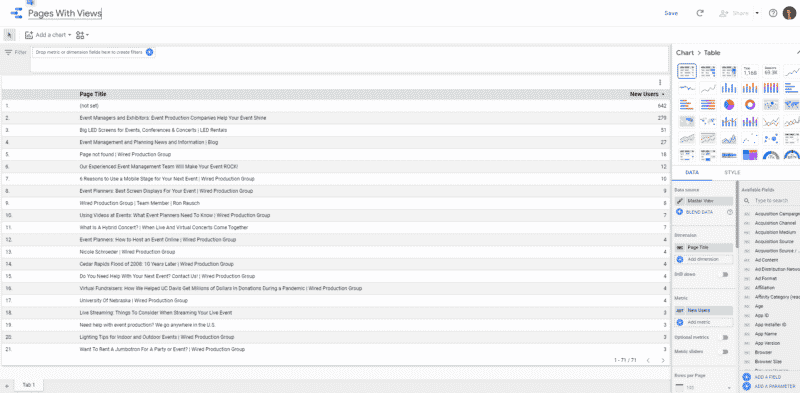
When you actually click on the Data Source (i.e. Master View in this example) you can see the data source. On this page you can view and edit the data source fields and settings. The fields are the information that will show in your reports.
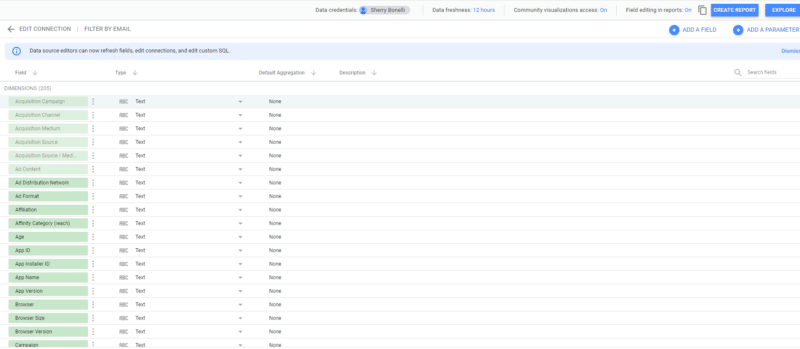
Remember, if you make changes (like the field name) to the data source, it will affect any of the reports that use this data.
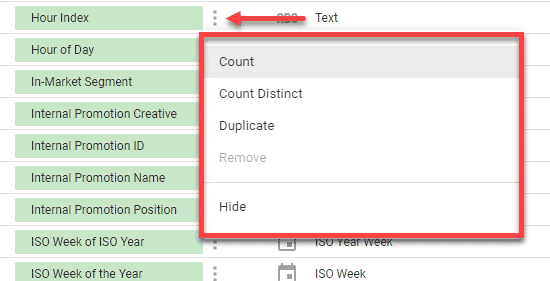
Next to each field, when you click on the three-dots menu, you can make changes to individual fields – like duplicate, hide, remove and more.
When you are finished, click Done.

If you want to add another data source to this report, like Search Console, for instance, just click Add a Data Source and go through the connecting process like before.
You have plenty of data options to choose from – there are about 500 different connectors!
The layout, information and data metrics you can pull into one report is incredible and valuable to anyone who wants to see how their marketing efforts are performing in an easy-to-understand format.
Here are just a few examples of the type of data you can display in reports using Data Studio:

Demographics

Channel comparison

Referring sites

Traffic by region

You will want to play around with your reports, layout and data until you find the best way to visualize and display the data that best represents what you want to show your stakeholders. This will involve some trial and error.
Managing Data Studio reports
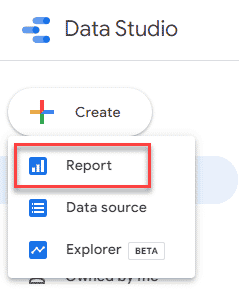
Reports are the thing that make Data Studio so wonderful! Another way to create a new report is to click on the +Create button in the upper left-hand corner of the home screen and from the drop-down, select Report.
However, once you start creating reports, it can get difficult to manage them.
Use the search feature if you’re unsure the exact name of the report you’re looking for or are having problems finding it.

If you have saved reports, you can click on the menu and either Share, Rename or Remove (Delete) the report.
It’s easy for clients to get information overload.
If you provide Data Studio reports to your clients, it’s nice to provide the client with a section in the report that explains how to read/use the report.

Depending on how you setup your report, you can sort your report in various ways, like by channel. This gives you a clear idea of how each channel is performing.

Sharing your Data Studio information
The beauty of Data Studio is you can share what you’re doing with others – whether it’s data source information or reports.
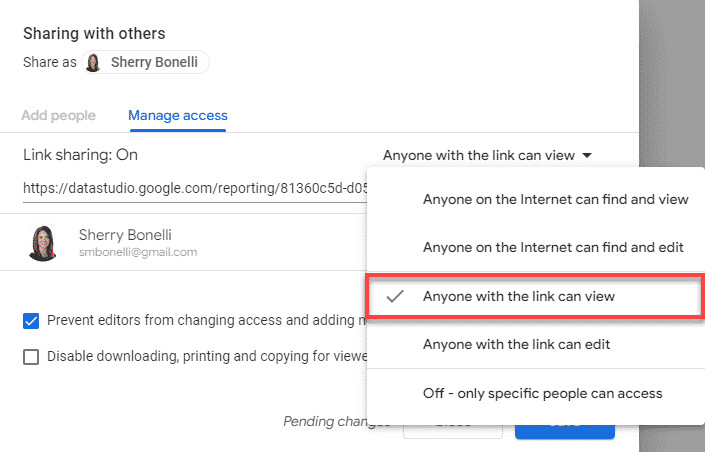
Sharing is easy. Just click on the Share button and then you’ll see the share dialog box.
Go through the prompts and determine what access rights you want to give the people you want to share the information with and add their email addresses.
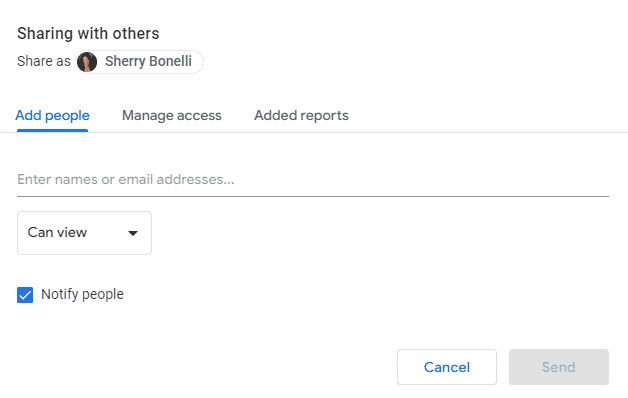
You’ll also be able to determine whether they can simply view the report or if they can make changes. There are other access rights options as well.
Important: only give the appropriate people the rights to actually make changes to your report.
Start using Data Studio
If you’re the type of person who likes working with spreadsheets, you might not think that Data Studio is a big deal.
But for the huge number of us who hate spreadsheets, this is a godsend. (Finally! You can take a look at your analytics data — and it makes sense.)
Now, when you’re talking to your clients, you can easily show them the results of your efforts in an easy-to-understand, brandable report.
By sharing these reports with your clients, they will be able to see how your marketing efforts are paying off, which is definitely good for your business.
If you aren’t already using Data Studio, there’s no better time to start than today so you’ll be ready to share amazing reports with your clients next month.
The post What is Google Data Studio and how you can use it appeared first on Search Engine Land.
Courtesy of Search Engine Land: News & Info About SEO, PPC, SEM, Search Engines & Search Marketing
Category seo news | Tags:
Social Networks : Technorati, Stumble it!, Digg, de.licio.us, Yahoo, reddit, Blogmarks, Google, Magnolia.
Webinar: Four elements of a powerful, data-driven martech stack
Written on July 13, 2022 at 6:13 pm, by admin

Consumer data is everywhere. The untold volumes of data from multiple personal devices bring endless opportunities for you to connect with the right person precisely when they are ready to act.
The art of delivering a “moment” – when a person interacts with a brand to get what they want immediately and in context – is no easy feat. This requires planning for, managing, curating, orchestrating and activating on data needed to power personalized, real-time marketing. Partnering with the right martech provider can support you on your journey.
Join Zeta’s EVP of Technology Strategy, Matt Mobley, who shares how to manage various data sources to get real-time personalization and moment-based marketing right. He is joined by guest panelist Jessica Liu, senior analyst at Forrester, David Wells, head of data marketplace development at Snowflake and Brian Stavis, global category lead, advertising and marketing technology at AWS.
Register today for “Four Elements of a Powerful, Data-Driven Martech Stack,” presented by Zeta.
The post Webinar: Four elements of a powerful, data-driven martech stack appeared first on Search Engine Land.
Courtesy of Search Engine Land: News & Info About SEO, PPC, SEM, Search Engines & Search Marketing
Category seo news | Tags:
Social Networks : Technorati, Stumble it!, Digg, de.licio.us, Yahoo, reddit, Blogmarks, Google, Magnolia.
Google My Business mobile app has stopped functioning forever
Written on July 13, 2022 at 6:13 pm, by admin
The Google My Business mobile app for iOS and Android no longer allows you to manage your business profile, communicate with customers or see insights. Now when you try to access it, the app says “the Google My Business app is no longer available.”
Screenshot. Here is a screenshot I took of the app screen from my iPhone:

Expected. This was expected, when Google rebranded from Google My Business to Google Business Profile last November, Google told us then that Google will retire the Google My Business app completely in 2022. That day has officially come.
Now what. Google is telling you to manage your Google Business Profile in the Google Maps app or in Google Search. Google said you can manage your Business profile, view your performance, and connect with customers directly on Google Maps and Search. You can also get notifications directly from the Google Maps app, so make sure to install that Google Maps and log in with your Business Profile.
Email. Google also emailed businesses late last night saying “beginning July 2022, the Google My Business mobile app will no longer be available, and the Google Maps app will be the best place for replying to customer messages on mobile. Turn on your notifications to ensure you’re notified by email and Google Maps push notifications for new incoming messages. You can also respond to messages from your Business Profile on Google Search.”
Here is a screenshot of the email I received:

Why we care. If you were accustomed to using the Google My Business app to communicate with customers, modify your business listing, check performance, and more – then you will need to switch to using the Google Maps app or Google Search. Again, Google has told us this change is coming and even emailed us a few times that this was going to happen soon. And it has – the Google My Business app is no longer.
The post Google My Business mobile app has stopped functioning forever appeared first on Search Engine Land.
Courtesy of Search Engine Land: News & Info About SEO, PPC, SEM, Search Engines & Search Marketing
Category seo news | Tags:
Social Networks : Technorati, Stumble it!, Digg, de.licio.us, Yahoo, reddit, Blogmarks, Google, Magnolia.
Google Analytics 4 adds conversion, bounce rate, and UTM parameters
Written on July 12, 2022 at 3:12 pm, by admin
Google Analytics 4 is introducing three new metrics to the platform this week. The metrics will be available to view across explorations, segments, audience, reports, and the Google Analytics data API. The new metrics added are:
- Bounce rate
- UTM term and UTM ad content
- Conversion rate
1. Bounce rate
Bounce rate is the percentage of sessions that were not completed due to a user exiting the landing page. These sessions are the opposite of the engagement rate. The Bounce rate metric is available in the Explorations and Reporting Customization.
In GA4, the Bounce rate is calculated differently than in Universal Analytics. You can learn how the new metric is calculated in the help doc.
2. UTM term and UTM ad content
These metrics are available in the Explorations, Reporting, and Audience Builder. Google has added both a user scope and a session scope dimension. For the UTM content parameter, you’ll be able to see the value assigned to first user manual ad content as well as session manual ad content. For the UTM term parameter, you’ll be able to view the first user manual term and session manual term.
3. Conversion rate
GA4 is now reporting on the conversion rate for any event. This includes both the user conversion as well as the session conversion rate.
You can review the release announcement from Google here.
Why we care. More data from Google is typically a good thing, especially when it comes after the release of a new product or feature. Additional insights into performance metrics should help advertisers diagnose and troubleshoot campaign performance issues.
The post Google Analytics 4 adds conversion, bounce rate, and UTM parameters appeared first on Search Engine Land.
Courtesy of Search Engine Land: News & Info About SEO, PPC, SEM, Search Engines & Search Marketing
Category seo news | Tags:
Social Networks : Technorati, Stumble it!, Digg, de.licio.us, Yahoo, reddit, Blogmarks, Google, Magnolia.
How and why marketers are revisiting PPC campaign organization
Written on July 12, 2022 at 3:12 pm, by admin
Over the past few years, match types have changed, smart bidding has become a little more intelligent and new campaign types have been introduced. These changes once again have advertisers reconsidering their account structures.
How are search marketers evaluating account structure and organizing campaigns in light of all these changes – and why?
We found out during a roundtable discussion at SMX Advanced, featuring myself, Duane Brown from Take Some Risk and Aaron Levy from Tinuiti. Brad Geddes from Adalysis moderated.
The session covered many of the changes the major search engines have made recently, including:
- Match types.
- New campaign types.
- RSAs.
This was a lively session with lots of great information, so buckle up!
How has campaign organization changed for you?
The prevailing thought on campaign organization was that the hyper-targeting of the past is no longer necessary. I’ve moved from granular campaigns segmented by match type to incorporating all match types in the same campaign, along with more automation and smart bidding.
Levy said he used to use single keyword campaigns segmented by audience. Now, they’re focused more on input optimization that’s more performance driven. Giving the right signals to the machine is key.
Automation was another theme here.
Brown said he is a fan of Performance Max campaigns for his ecommerce clients. However, he cautioned that Google is still not great at context, so figuring out when to consolidate and when to keep things separate is important.
What are the big things you look for when planning campaign structure?
The key here is intent. All three speakers mentioned understanding search intent as the basis for campaign structure.
Levy suggested that if performance is expected to be different enough to require separate targeting and messaging, split it into its own campaign. However, his default is to let the machines make better decisions faster.
I think about campaign structure in terms of intent, goals and budget. Where any of these vary, make a separate campaign.
Budgets may be client-driven by region or even content asset. But aside from that, don’t split out unless it’s necessary.
When asked about brand search, all three speakers agreed that brand should usually be broken out separately, to maintain brand protection and its place in the buyer journey, which is usually bottom of the funnel.
What do you no longer segment on that you used to?
I no longer segment by match types. This used to be done at the campaign level but is completely unnecessary now.
It also isn’t necessary to use every match type. Pick the best match type for each keyword instead.
Levy added that for ecommerce, they used to segment by product type. They still do this when performance dictates, but it’s not something they always need to do.
How has ad group structure changed?
Fewer ad groups and no more breaking out by match type was mentioned by all panelists.
While broad match performs better now than it did a year ago, Brown noted that he does break out this match type for testing.
Levy is a fan of consolidation. They used to structure ad groups by match type, but now incorporate all match types in the same ad group.
What about RSAs? Some people are using one headline per product in the same RSA and assuming Google is matching them up with the right product. Are you still separating RSAs by theme?
I still segment RSAs by product, with each ad specific to the content and theme and using variations of headlines and descriptions.
Incorporating multiple products into a single ad is better as a DSA. DSAs are rarely used in B2B and have to be carefully set up to be successful.
Levy added that they still split out DSAs. DSAs have improved but still make questionable calls, so they use them primarily as a research tool.
Levy is also writing separate headlines by theme for his RSAs. Be careful of including the keyword over and over in multiple headlines – make sure the combinations make sense.
Do keywords still matter?
Brown said yes, but maybe not as much as they did five years ago. Keywords still have value, though.
Brown uses DSAs as a “sweeper campaign” to find unusual keywords they wouldn’t think of otherwise.
Levy addressed the common theme of “keywords are dead” by saying that keywords died and came back as something else.
Google has a branding problem with keywords and match types. Neither are what they used to be, and the names do not mean what they used to.
Keywords are now thematic, audience-based or language-based. But they’re still important.
Do you trust that Google will show your ads for all the possible search terms?
Sometimes Google is surprisingly good at matching keywords to search terms. Google seems to have figured out that B2B advertisers are looking for B2B customers.
But I still see a lot of bad matches, where Google doesn’t seem to understand what the advertiser is selling. Advertisers should be cautious not to put all their trust in Google.
We still need keywords and negative keywords. As I mentioned during the roundtable discussion, Google hides about 75% of search queries in many of her B2B accounts.
In the end, it comes down to signals. The more signals you can give Google with your keywords, audiences and goals, the better results you’ll get.
Levy added that we now have a combination of image and language search. When someone is searching for an image, what do you bid on?
He believes intent will take a larger role in the future because intent is a mix of people and language. For B2B – who is searching? An administrative assistant, or the decision-maker?
Advertisers need to go beyond just keywords. They need first-party and third-party data. Google makes decisions on what they can see, we need to feed them as much as we can.
It’s possible to have the same search term showing in multiple ad groups. Should you include every single search term as a keyword? Does Google really match them up exactly? Are you adding all the queries or letting it ride?
Brown said that if there are enough conversions, he will add the search term and adjust bids. But if query volume is low, it doesn’t make sense to add the keyword because it won’t move the needle.
Also, remember that as a PPC manager, you have to manage your campaigns. Will adding the search term help, or just be more work?
I usually add the search terms if they’re converting. I also still try to do some keyword sculpting, although that has become less important.
Also, a term may convert, but on a keyword that’s not as relevant as another keyword elsewhere in the campaign. It’s important to think about the best place to add the search term – don’t just click “add” in the search term report.
Regarding automation: It’s generally believed that Performance Max and Discovery campaigns are the least liked campaign types. How are we thinking about these campaign types? Are they core for you, or backfill, or are you just not using them at all?
Levy quipped that in golf, a “Max” score is for the bad players! He feels that while performance max may take a bigger role in the future, it will not be the only option.
Levy is cautiously optimistic about Performance Max. It’s performing well but is under-baked. It’s not a core campaign for him as there are too many unknowns and not enough targeting, and it makes bad decisions, especially in B2B.
Brown is bullish on Performance Max. He thinks that in a year, people will say they love it. After all, people love things when they work. The black box is what people don’t like.
Google needs to test things in the real world to find problems, and agencies need to learn use cases for each new offering.
Regarding Discovery campaigns, Brown loves them. The right audience is necessary. Discovery campaigns can convert for prospecting, but you need to change creative faster, like you would with Facebook as opposed to Google.
What’s your advice to someone with 3-5 years’ experience in PPC?
Brown recommended forgetting everything you knew 5 years ago, because Performance Max has changed the game. Think about what you want to show for and what you want to match for. Our job isn’t to push buttons but to understand what’s making more money.
Levy reminded us that those with 3-5 years’ experience are still learning, so it might actually be easier for them. Those who are long time PPC pros have established habits that are hard to break. Learn new resources, approach with skepticism but devote time to learn how the sausage is made. Influence decisions and adjust accordingly.
My suggestion: managers should think about the signals they’re giving to the machine and let the machine do the manual work.
Search is not a list of tasks to check off. Dig in and see what’s working and why.
Think more strategically: “what are my objectives and what do I need to do to make it better?”
Bonus Round! Highlights from the Q&A
What about industries with compliance concerns?
I have a lot of B2B clients with compliance issues. Sometimes you have to do old-school segmenting across match types with lots of negatives.
Align things as best you can while still explaining to your client that exact match isn’t like it used to be.
In heavily regulated industries sometimes broad match is out of the question. Often, you really have to go old-school and avoid many of the new campaigns and automations as much as possible in order to maintain compliance.
How do you handle match type breakouts with brand search?
Levy said he breaks things out based on definitions that are the same across similar brand terms. With brand, he is doing more old-school segmenting and more negatives, because brand can bleed into non-brand and vice versa.
How do you go about increasing reach and volume while maintaining relevancy?
Brown believes in adding more keywords rather than using broad match, and in adding audiences. That said, broad is worth testing. Also, retry things you tested before – they might work now!
Are you even doing query mapping anymore?
Levy is letting Google figure it out unless messaging is critical. Usually, Google does a good job with this.
Geddes added that his high-spend clients still do query mapping, and see a huge conversion increase from doing so.
There are struggles with RSAs due to lack of data. How do you think about structure in an RSA world?
- Levy: “People try to clone ETAs to RSAs. Make sure each ad element says something new or else it becomes repetitive.”
- Geddes: “Pinning is really flexible. You can pin multiple headlines to a single line.”
Google has been pushing using RSAs and broad match. Is this useful?
Levy has done this a lot. They are starting to see some cannibalization, but 90% of the time Google picks the right match – if you are using smart bidding.
Do not do this with manual bidding. There are too many variables.
What about ecommerce, non-Performance Max campaigns? Any quick structure tips?
Brown suggested using analytics to break out top products and low-performing SKUs. You’ll need multiple campaigns.
Performance Max vs. shopping – are you getting worse ROAS with performance max?
Brown has done a lot of testing with Performance Max. ROAS is equal to or better than smart shopping, but you need to use the right creative and ad formats.
Is Google performing better or the same now with broad match?
Broad match, which used to be a B2B nightmare, is performing way better. If the keywords are long-tail enough, broad match does well.
Lightning round! Where are we going with match types?
- Me: “A lot less visibility into performance, but there’s lots to test.”
- Brown: “Give up control and hope we get insights.”
- Levy: “Make it ok for the machine – put guardrails in.”
- Geddes: “Override the machine if needed.”
Watch the roundtable discussion at SMX Advanced 2022
To listen to the roundtable discussion yourself, get your free pass here.
Already registered for SMX Advanced? Log in.
The post How and why marketers are revisiting PPC campaign organization appeared first on Search Engine Land.
Courtesy of Search Engine Land: News & Info About SEO, PPC, SEM, Search Engines & Search Marketing
Category seo news | Tags:
Social Networks : Technorati, Stumble it!, Digg, de.licio.us, Yahoo, reddit, Blogmarks, Google, Magnolia.
Webinar: Paid search tactics you need to maximize ROI in a tight economy
Written on July 12, 2022 at 3:12 pm, by admin

As we enter economic uncertainty, many leaders are looking for ways to make the most out of their marketing budgets. Paired with customer behavior becoming increasingly turbulent and less predictable, you are now faced with maximizing your ROI.
We’ll highlight case studies of clients who’ve already reaped the benefit of sharpening their paid search strategy including Sage and how they achieved a 75% decrease in CPCs.
Register today for “Paid Search Tactics You Need to Maximize ROI in a Tight Economy,” presented by Adthena.
The post Webinar: Paid search tactics you need to maximize ROI in a tight economy appeared first on Search Engine Land.
Courtesy of Search Engine Land: News & Info About SEO, PPC, SEM, Search Engines & Search Marketing
Category seo news | Tags:
Social Networks : Technorati, Stumble it!, Digg, de.licio.us, Yahoo, reddit, Blogmarks, Google, Magnolia.
Google adds 4 new features for Performance Max campaigns
Written on July 12, 2022 at 3:12 pm, by admin
Google Performance Max campaign users will soon notice four new features in their accounts.
What’s new. The four new Performance Max campaign features are:
- Seasonality adjustments are intended to allow advertisers to adjust the bid strategy based on anticipated changes in conversion rates for events such as holiday sales. Because Smart Bidding already exists for predicted seasonal events, advertisers should only use the adjustments for changes that are otherwise atypical. The adjustments should be used for long weekend promos or sales that typically last between 1-7 days.
- Data exclusions will tell Smart Bidding to ignore data from dates where you may have encountered issues with conversion tracking which may have impacted the accuracy of your data. An example of this would be website outages, bugs or tagging issues.
- Explanations will make it easier for advertisers to identify performance fluctuations and diagnose issues. The feature will also provide recommendations to help improve performance. If you have a product feed, the explanations will analyze the product status as well as top moving products, groups and types. This will become available for PMax campaigns in the coming weeks.
- Optimization Score allows advertisers to see where the campaign has room for improvement and finds recommendations to help you take action to try and drive better results.
Recent releases. Google also announced two new features that we reported on last week. These were advanced location targeting controls and diagnostic insights.
Best practices. You can understand more about Performance Max campaigns and read Google’s best practice guide here.
Why we care. Google is attempting to give advertisers more transparency and control over their Performance Max campaigns. While many advertisers agree that this is a step in the right direction to better control and performance, they should also be aware that the explanations and optimization score recommendations are guidelines, not required fixes. Always test your campaigns and monitor them on a regular basis. Make campaign adjustments based on data and your unique business.
The post Google adds 4 new features for Performance Max campaigns appeared first on Search Engine Land.
Courtesy of Search Engine Land: News & Info About SEO, PPC, SEM, Search Engines & Search Marketing
Category seo news | Tags:
Social Networks : Technorati, Stumble it!, Digg, de.licio.us, Yahoo, reddit, Blogmarks, Google, Magnolia.
Creating better ads in a world with only RSAs
Written on July 11, 2022 at 12:03 pm, by admin
Frederick Vallaeys spent 10 years working at Google and was instrumental in helping build features like conversion tracking and analytics. For the last 10 years, he’s been running his current company Optmyzr, which is a PPC management software that helps advertisers optimize their campaigns. In his session at this year’s SMX Advanced, Vallaeys goes into detail on how to make the most out of your RSAs and automated bidding strategies.
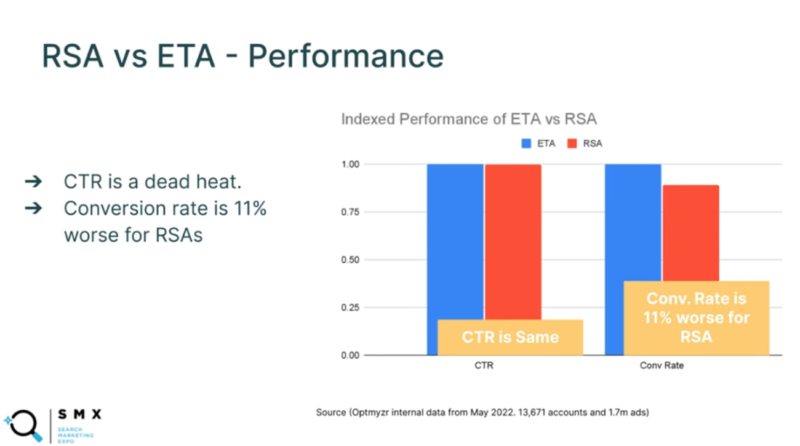
The numbers. About 92% of advertisers have shifted to using RSAs, and the majority of those who have turned them on or used them, leave them on without shutting them off. Vallaeys hypothesizes that even years ago when advertisers didn’t know that RSAs were going to be the only option, performance was good enough that advertisers were willing to stick with them.
Vallaeys goes on to say that of the 1.7 million ads they audited, the CTR was almost exact between RSAs and ETAs. However, the conversion rate was about 11% worse with RSAs. They found that ad groups with RSAs received 1.6 times as many conversions as ad groups without RSAs. And that’s all we really want, right? More conversions.
Making the leap to RSAs. Google recommends taking your existing ETAs and start building your RSAs. Google claims that without making any changes to the ad text, creating an RSA will result in about a 7% increase in conversions with a similar cost per acquisition.
Vallaeys and the team at Optmyzr even wrote a script that you can download to make the transition from ETAs to RSAs much easier. You can download the script here.
Smart bidding strategies. Vallaeys is a fan of using smart bidding with RSAs, though when it comes to using broad match keywords, he says that’s up to the advertiser. Google did studies where they found a 20% “lift” when enabling smart bidding and broad match keywords. Though they didn’t clarify if the “lift” was an increase in clicks, CTR, or conversions.
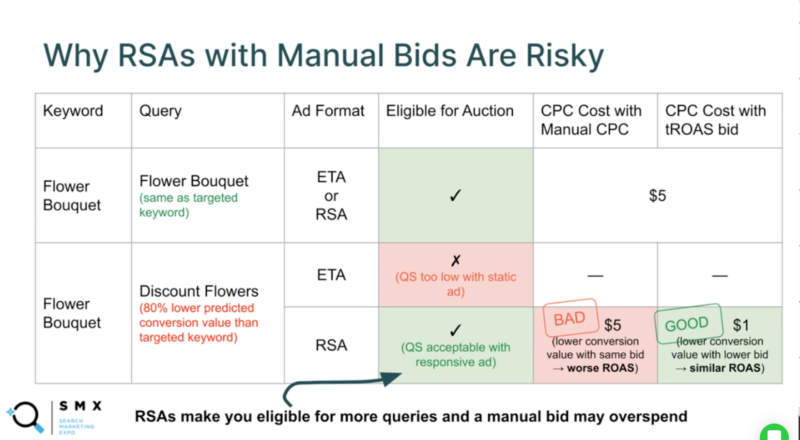
Vallaeys reminds us that with an automated bidding strategy with RSAs, Google will show ads that match your keywords, even if the queries aren’t exactly the same. If the keyword or phrase is similar and your ad shows, you may be stuck paying a higher CPC than you normally would if the bidding were left up to Google. The chart below outlines the differences in what you could pay if your campaigns were left on Manual CPC.
Google loves scores. Ad strength is another score in your account. Vallaeys explains that ad strength scores tend to help newer advertisers, but seasoned ad veterans know that it’s not related to actual performance. Ad strength scores are suggestions gathered from other advertisers and “what everyone else does.” Limited Eligibility status is now gone and “Poor” ad strength is not an indicator of how well your ads will serve, so take it with a grain of salt.
One interesting experiment that Vallaeys outlines is that Google suggested adding specific text into the ads and indicated that it would increase the ad strength. When that text was manually added by typing the words in, the ad strength didn’t get better. But when they click the link that Google gives you to add the exact same text, the ad strength got better. This experiment may indicate that ad strength as a statistic or measuring tool isn’t that sophisticated.
RSA structure. Based on the 1.7 million ads that Optmyzr has analyzed, Vallaeys provides several tips to help make the most of our ads:
- Having two RSAs per ad group seems to be ideal for improving conversion rates
- Use labels to connect RSAs with automation
- Use pinning techniques to fake ETAs or leave ad combinations exactly where you want them (this is suggested if you have been testing for a long time and know what works)
- More headline variants lead to more impressions
- Adding DKIs and ad customizers may increase impressions, but likely decreases conversion rates
- RSAs need to be tested against RSAs. RSAs cannot be tested against ETAs simply because they’re too different
- Don’t fixate on old metrics
- Use ad variations to test and iterate creative (on the Campaign level, under the Experiments link)
Don’t miss Frederick Vallaeys session in SMX Advanced 2022
For more details on testing and optimizing RSAs and the results of the experiments Optmyzr ran, get your free pass here.
Already registered for SMX Advanced? Log in.
The post Creating better ads in a world with only RSAs appeared first on Search Engine Land.
Courtesy of Search Engine Land: News & Info About SEO, PPC, SEM, Search Engines & Search Marketing
Category seo news | Tags:
Social Networks : Technorati, Stumble it!, Digg, de.licio.us, Yahoo, reddit, Blogmarks, Google, Magnolia.
Webinar: Reimagine your customer experience strategy
Written on July 11, 2022 at 12:03 pm, by admin

Personalizing your marketing campaigns for one customer is easy, but how about one hundred or thousands of customers across multiple marketing channels?
Work smarter, not harder, by using artificial intelligence (AI) as part of your martech stack and giving your customers the unique experiences they crave.
Register today for “Use Data to Create Next-Level Customer Experiences at Scale,” presented by MoEngage.
The post Webinar: Reimagine your customer experience strategy appeared first on Search Engine Land.
Courtesy of Search Engine Land: News & Info About SEO, PPC, SEM, Search Engines & Search Marketing
Category seo news | Tags:
Social Networks : Technorati, Stumble it!, Digg, de.licio.us, Yahoo, reddit, Blogmarks, Google, Magnolia.