Decoding Googlebot crawl stats data in Google Search Console
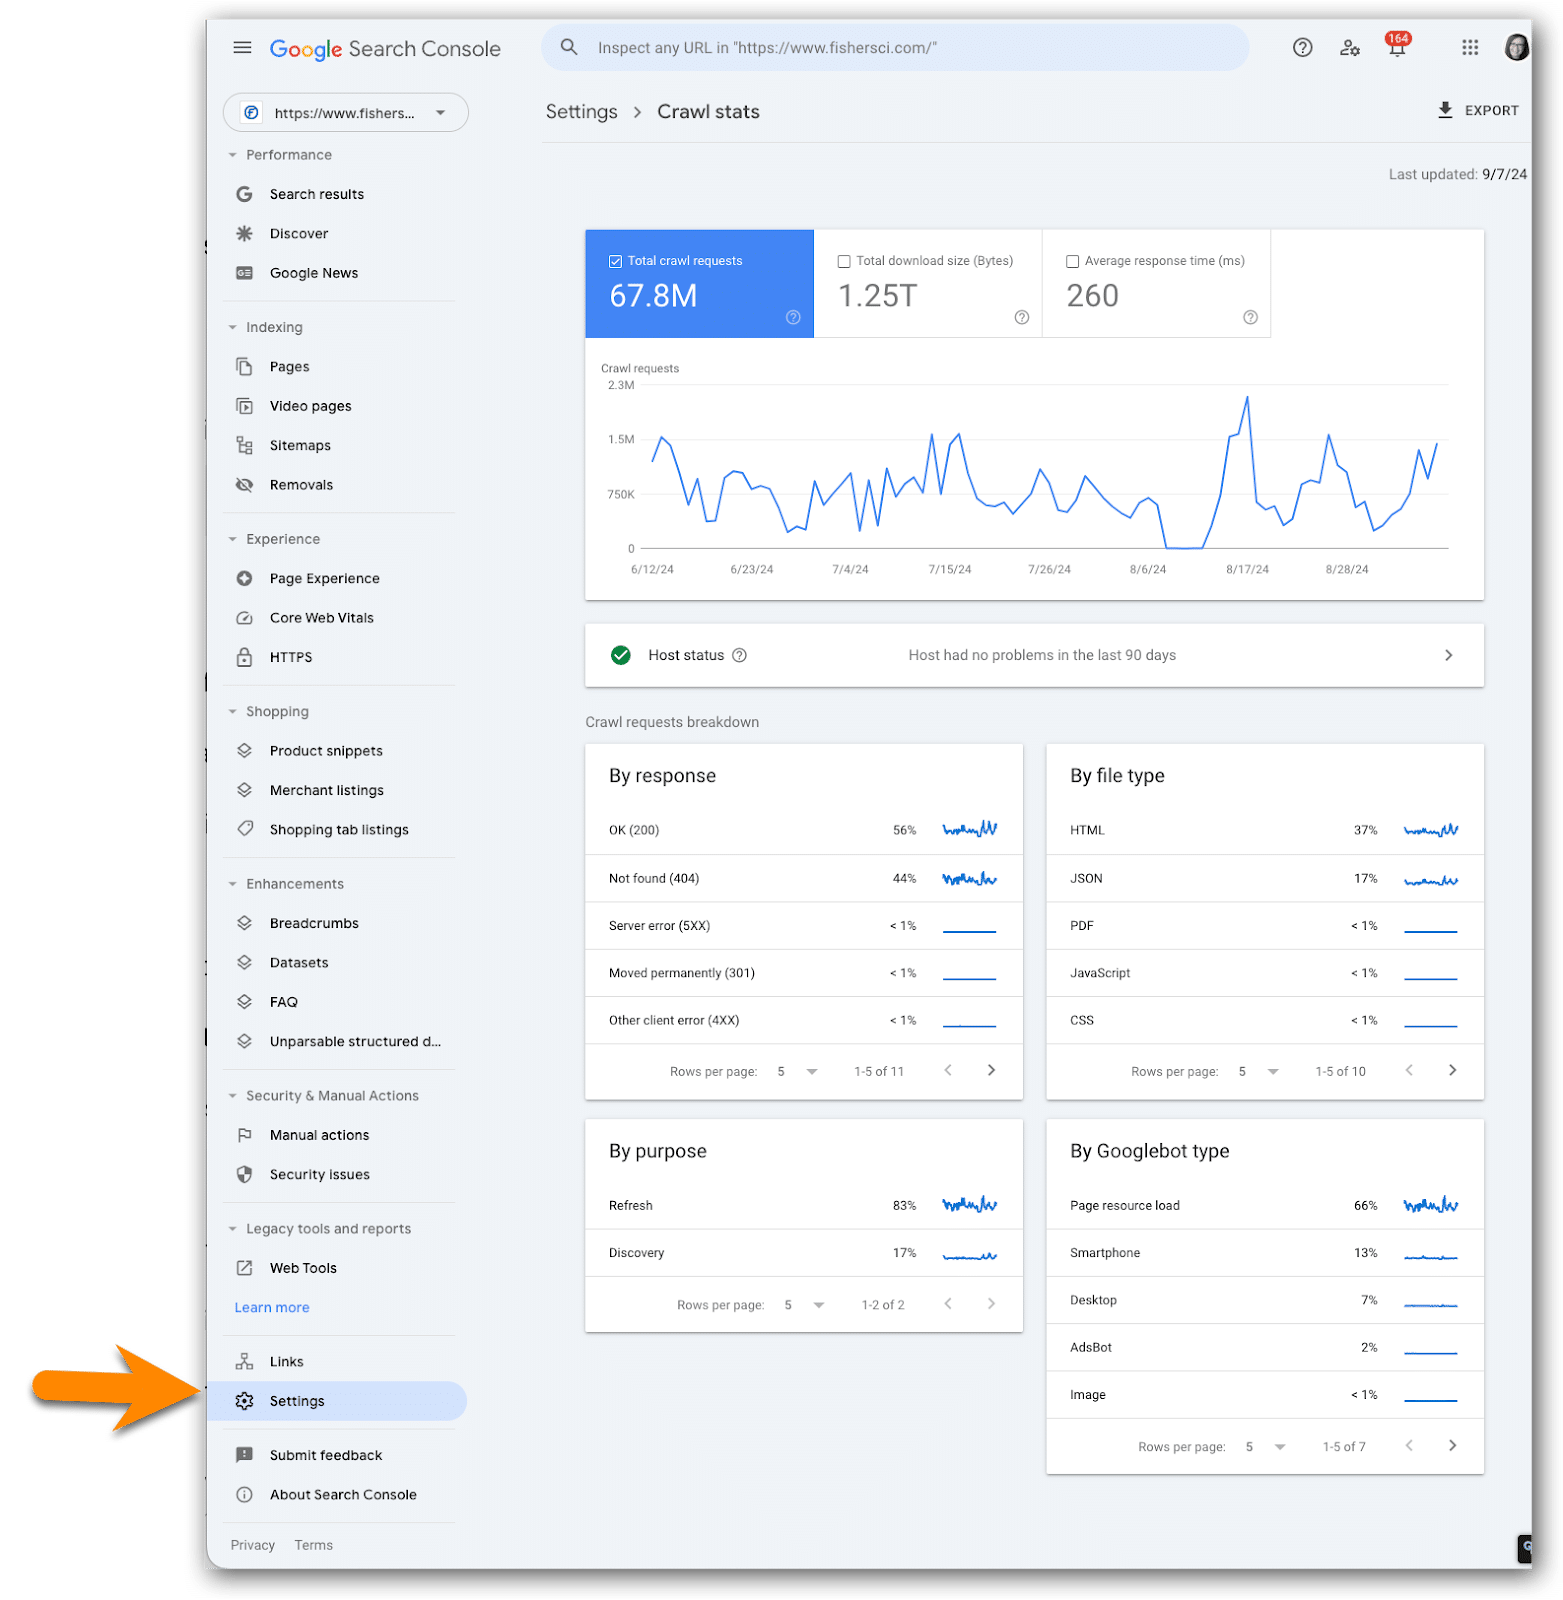
Tucked away in the Settings section of Google Search Console is a report few SEO professionals discuss, but I like to monitor.
These reports are known as Crawl Stats.
Here, you’ll find an interesting set of metrics on Googlebot crawl activity. These metrics are especially useful for websites with thousands or millions of pages.
Googlebot ‘Crawl stats’
Long ago, Google Search Console had easy-to-find metrics on Googlebot crawl activity. Then, it seemingly disappeared.
In reality, it was tucked away in the Settings section.
How to access the crawl stats reports:
- Click on Settings at the bottom of the left navigation.
- Go to the Crawl stats section.
- Click Open report.
About the crawl stats data
As Googlebot crawls your site, Google tracks and reports on various aspects of Googlebot’s activity and reports on it in Google crawl stats.
This is where you’ll find high-level statistics about Google’s crawling history on your website.
Google says this data is for advanced users
The Googlebot Crawl Stats data is not for the technical SEO rookies.
Google specifically says this data is aimed at “advanced users” with thousands of pages on their site, which may be why it’s located in such an unusual location, unseen by many in the SEO community.
One reason Google may perceive this as an advanced report is that so many things can influence these metrics, including network issues and cloud delivery services such as Akamai.
Who will find crawl stats most useful?
I find the Crawl Stats reports less of an “advanced” set of reports but something that’s more useful to enterprise SEOs without crawler monitoring tools such as Lumar and Botify.
When doing SEO on an enterprise website with thousands or millions of pages, crawler optimization is a vital task, and crawler activity metrics provide important insight for defining action items.
Smaller sites likely do not need to worry too much about crawler activity because there is probably enough crawl budget allocated to your site to crawl at an appropriate pace.
On the other hand, enterprise sites tend to have far more pages that need to be crawled, discovered, and/or refreshed than Google crawls their site each day.
For this reason, they must optimize for crawler activity, which is a tool to help guide next steps.
What to look for in this data
After years of reviewing this data across many sites, I have one primary rule:
- Do not spend a lot of time here unless you see fluctuations and correlations.
Often these reports are interesting but not actionable.
Example fluctuations that I tend to investigate:
- HTML requests decreased (or spiked) at the same time Bytes of JavaScript downloaded increased (or spiked).
- Average response time increased (or spiked) at the same time the number of HTML requests went down (or sudden fall).
- Total download size increased (or spiked), but the number of HTML requests did not change.
- The percent of requests for discovery (to discover new URLs) increases and the percent of requests for refresh goes down; however, you did not launch new URLs on the site.
When to look at this crawl stats
Crawl stats are good to peruse (and log) at least once a month.
They are especially good to monitor after major releases, such as a platform migration or major redesign. This will help you quickly understand how Google is responding to your newly launched changes.
Remember: If you have a bot monitoring tool such as Lumar or Botify, then this data isn’t as useful as you’ll find in the bot monitoring data provided by these tools.
Caveats about the crawl stats data
Many things can influence Google’s crawl stats metrics beyond a normal dev release.
This means the SEO team, product manager(s) and developer(s) must think outside the box when evaluating the fluctuations.
You must consider what could have caused an increase or decrease in Googlebot crawl activity, not only in your release but also within the network and tech stack.
Changes to something such as Akamai could potentially impact this data.
Log the crawl stats data in a spreadsheet
This is data I like to archive because Google reports such a small window of time.
A great example of this is a challenge I’m facing now with a client. What is reported in GSC right now looks like things are improving:
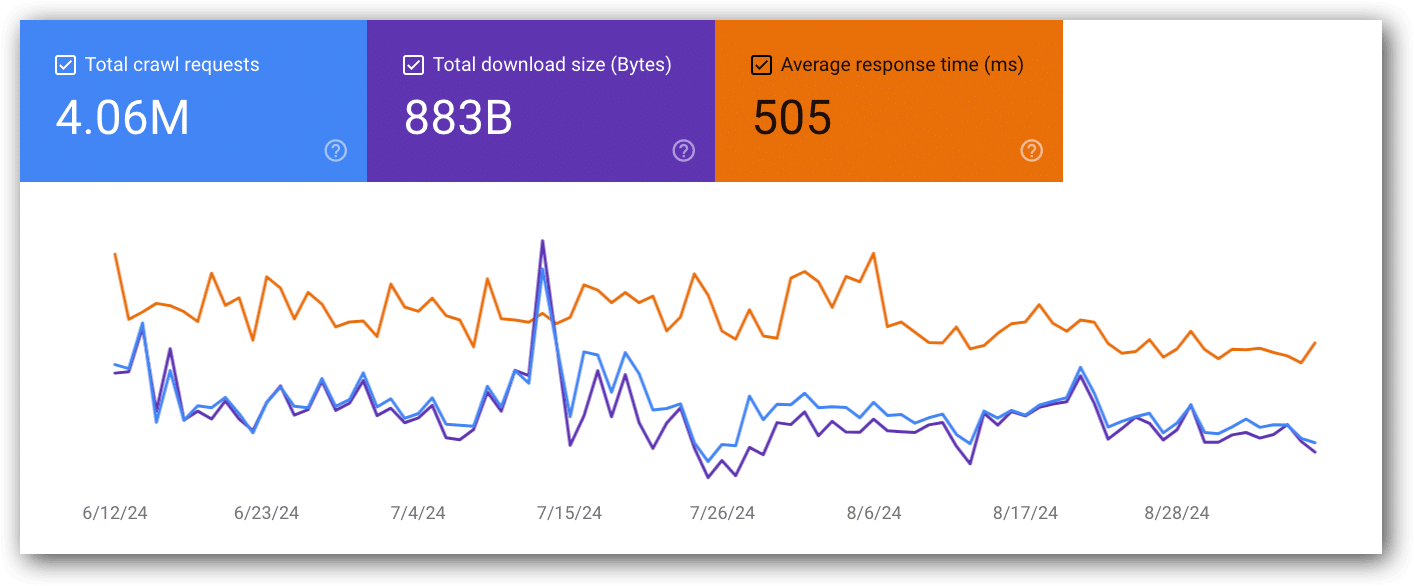 Seemingly, things are improving
However, because I have metrics from six months ago, I can say that these metrics are 40% higher than they were six months ago.
While they’re trending down, they’re still worse than they were in the past. The client’s challenge is that development has no idea why this is happening (unfortunately, solving that problem is beyond the scope of this article).
You may think to just grab a screenshot. However, it makes it very hard to compare over time.
Notice there is no left axis in the chart. You really cannot tell what the lines reflect. (Note: Numbers do appear on the left/right axis when you are only viewing two metrics in the chart)
Instead, drop this data into a spreadsheet. Then, you have actual data that can be charted over time, calculated and used to compare with other metrics, such as visits.
Having the historical data in one place is often useful when discussing major changes with development to show how much better the metrics were 4-6+ months ago.
Remember, development likes hard, specific data, so charts with actual numbers on the left/right axis (or worse, no numbers on the x-axis at all) will be more useful to you than charts with varying numbers on the x-axis.
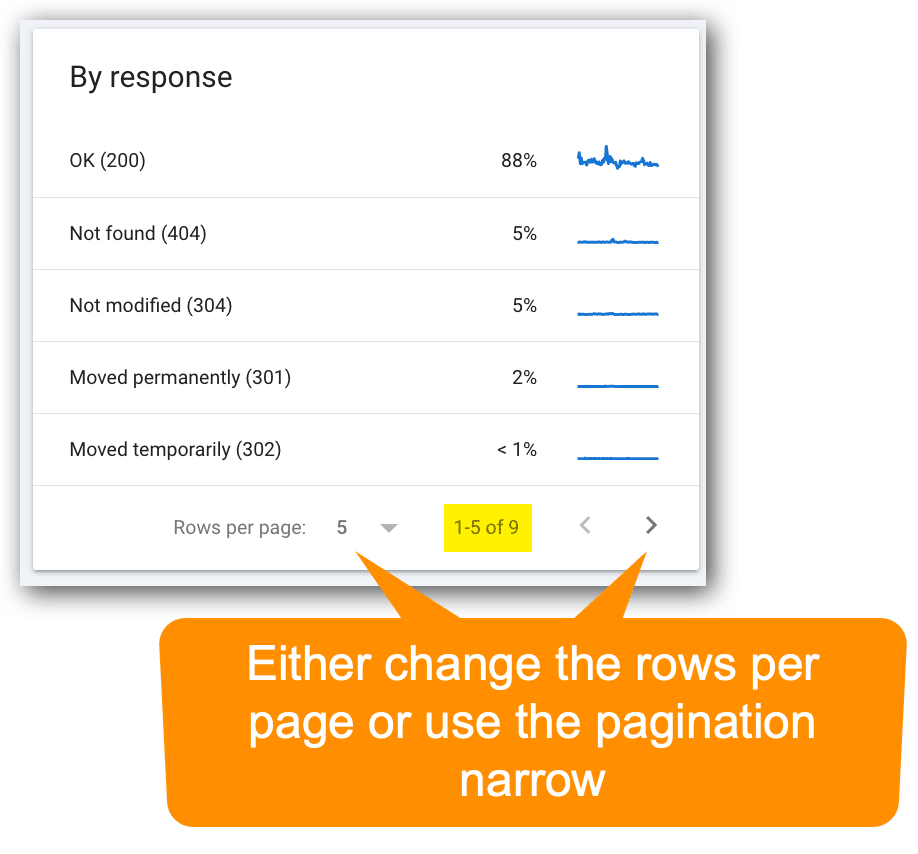
Remember, the reports boxes are paginated
Though the most important metrics you’ll need are likely visible in the default view, many of the report sections are paginated – and they’re easy to miss!
Which metrics to monitor and why
Let’s get into the primary metrics to look (very quickly) each month, along with a few tips to take away action items from the data:
Total crawl requests
- View this report in Google Search Console (located in the top chart).
- Google definition: “The total number of crawl requests issued for URLs on your site, whether successful or not.”
- If this metric goes up or down, compare it with average response time and total download size (bytes).
- An obvious reason for this metric could go up if you change a lot of code or launch a lot of new pages. However, that is by no means the only cause.
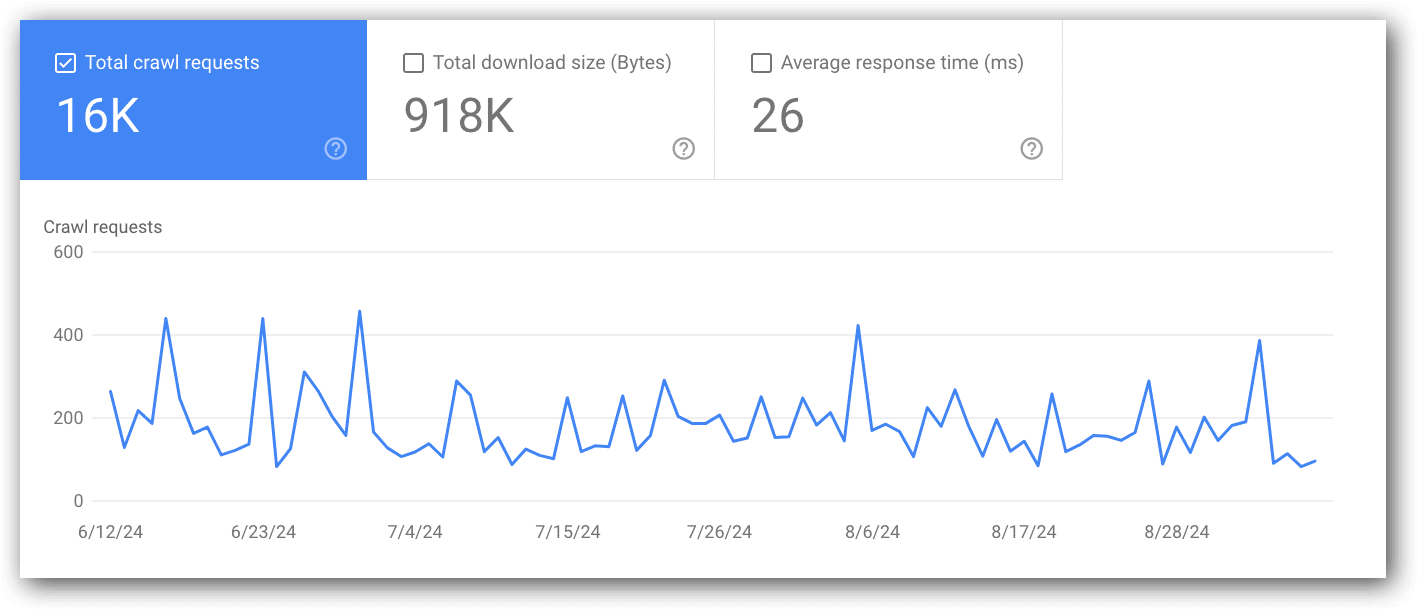
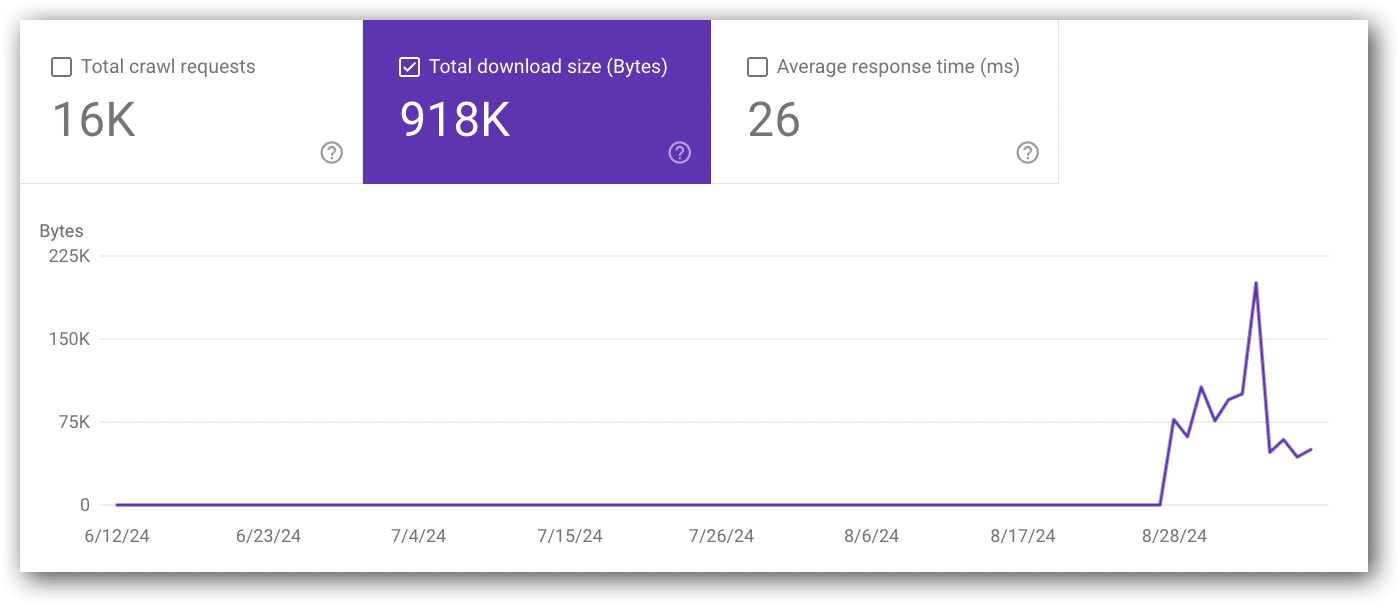
Total download size (byte)
- View this report in Google Search Console (located in the top chart).
- Google definition: “Total number of bytes downloaded from your site during crawling, for the specified time period.”
- If this metric goes up or down, compare it with average response time
- An obvious cause for this metric to increase is adding a lot of code across thousands of pages or launching a lot of new pages. However, that is by no means the only cause.
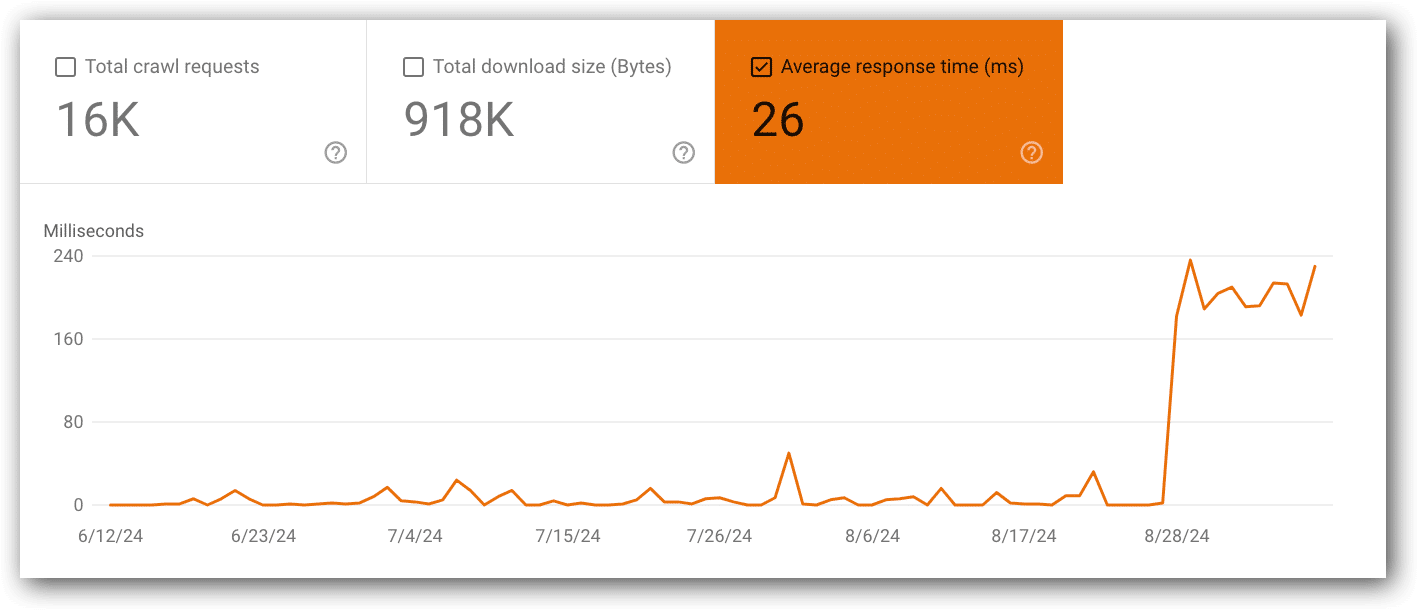
Average response time (ms)
- Google Search Console Report (located in the top chart).
- Google definition: “Average response time for all resources fetched from your site during the specified time period.”
- If this metric goes up or down, compare with with total crawl requests and total download size (bytes).
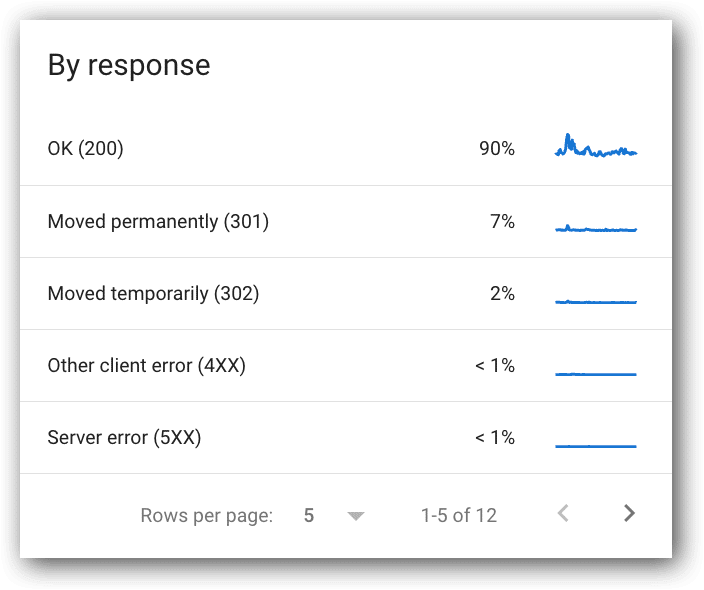
Crawl requests breakdown by response
- View this report in Google Search Console (located below the top chart).
- Google definition: “This table shows the responses that Google received when crawling your site, grouped by response type, as a percentage of all crawl responses…”
- Common responses:
- OK (200).
- Moved permanently (302).
- Server error (5xx).
- Other client error (4xx).
- Not found (404).
- Not modified (304).
- Page timeout.
- Robots.txt not available.
- Redirect error.
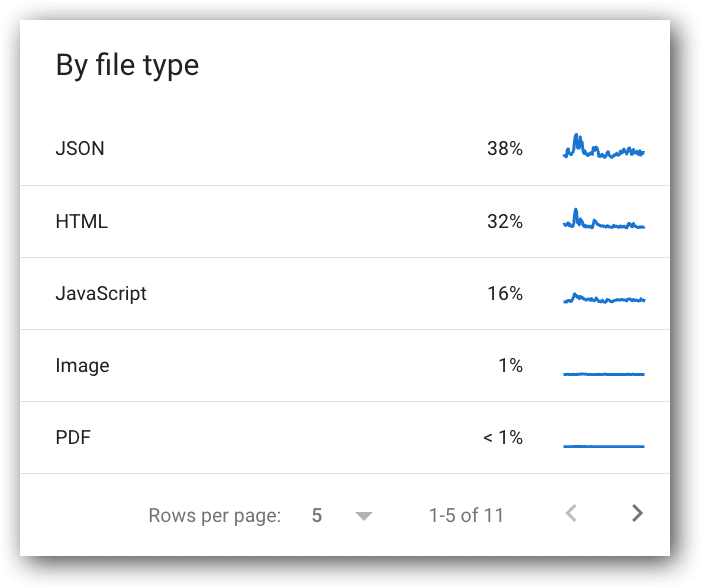
Crawl requests breakdown by file type
- View this report in Google Search Console.
- Google definition: “The file type returned by the request. Percentage value for each type is the percentage of responses of that type, not the percentage of of bytes retrieved of that type.”
- Common responses:
- JSON.
- HTML.
- JavaScript.
- Image.
- PDF.
- CSS.
- Syndication.
- Other XML.
- Video.
- Other file type.
- Unknown (failed requests).
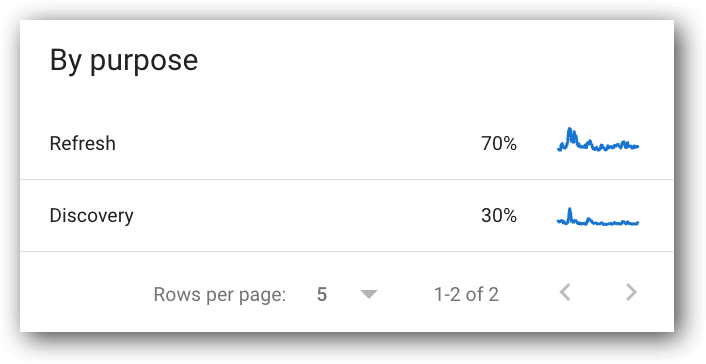
Crawl requests breakdown by crawl purpose
- View this report in Google Search Console.
- Two purposes:
- Refresh.
- Discovery.
- This is an interesting metric for presentations; however, it only has a few useful use cases. For example:
- If the percent of Googlebot activity that is for Discovery suddenly increases, but we’re not adding URLs to the site, then you have an action item to figure out what is being crawled that shouldn’t be crawled.
- If the percent of Googlebot activity that is for Refresh decreases significantly, but you didn’t remove pages from the site, then you have an action item to figure out why fewer existing pages are being crawled.
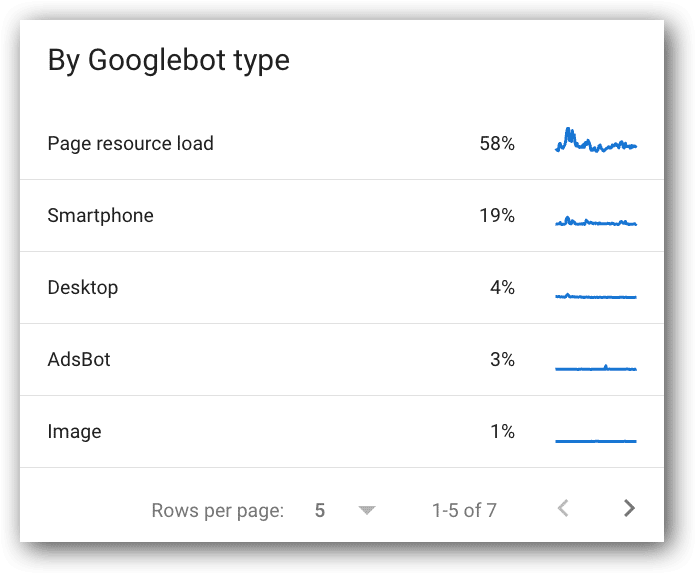
Crawl requests breakdown by Googlebot type
- View this report in Google Search Console.
- Google definition: “The type of user agent used to make the crawl request. Google has a number of user agents that crawl for different reasons and have different behaviors.”
- It’s an interesting metric, but not very useful. It just shows Google is still using their desktop crawler. Honestly, I usually ignore these metrics.
You can click into each metric for more data
Often when you present any SEO concern to product managers and developers, they often want to see example URLs. You can click on any of the metrics listed in this report and get example URLs.
An interesting metric to look at is “other file types” because it’s not clear what’s in the “other file types” category (often it’s font files).
The screenshot below shows the examples report for “other file type.” Every file listed is a font file (blurred out for confidentiality reasons).
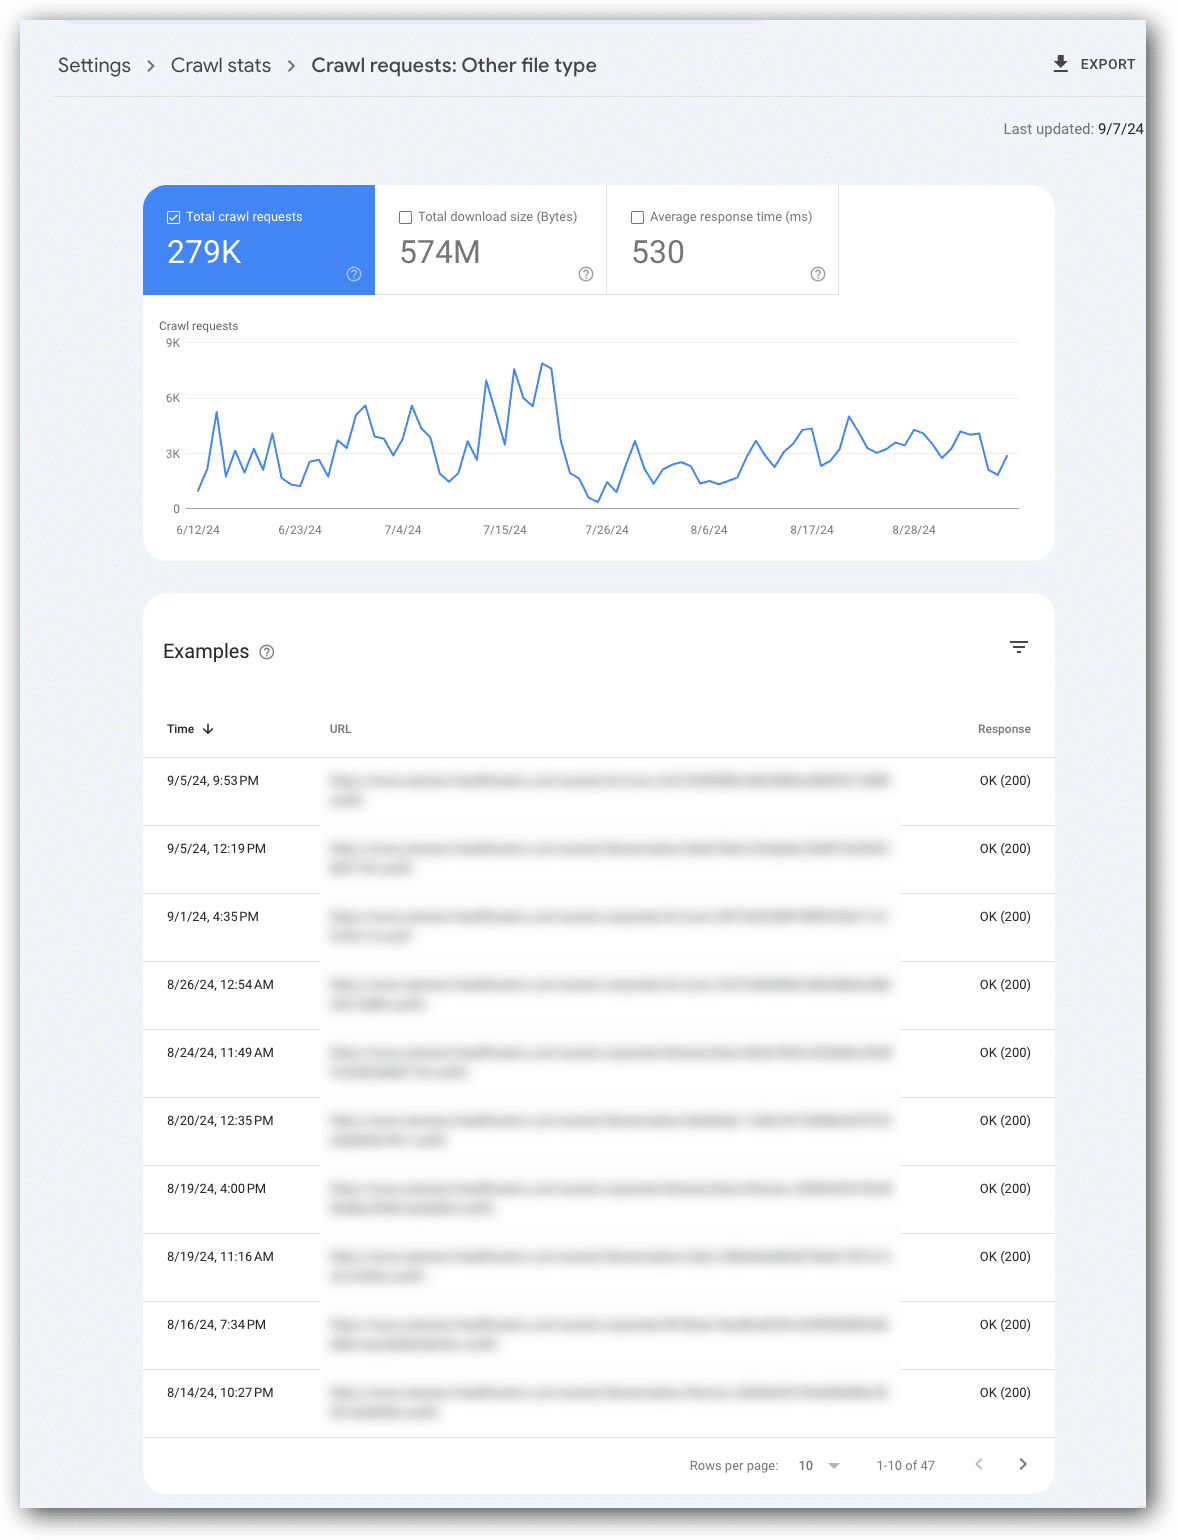
In this report of examples, each row reflects one crawl request. This means if a page is crawled multiple times it could be listed more than once in the “examples.”
As with all Google Search Console reports, this is a data sample and not every request from Googlebot.
Do you share these metrics with developers and product managers?
These metrics will typically generate one of two thoughts:
- “There’s nothing to look at here.”
- “What could have caused that?”
In my experience, the answers to “what caused that” tend to require the input of product managers and/or developers.
When presenting the data and your questions about potential causes for issues, remember to clearly explain that these metrics are not user activity and solely represent Googlebot’s activity and experience on the website.
I find product managers and developers often get a bit confused when discussing this data, especially if it doesn’t match up with other metrics they have seen or facts they know about the site.
By the way, this often happens for most Google Search Console data conversations.
If there are no Crawl Stats fluctuations or correlations to be concerned about, don’t bring it up to development, nor product management. It just becomes noise and prevents them from focusing on more critical metrics.
What’s next?
Check out your crawl stats to make sure there are no spikes or correlations that are concerning.
Then, determine how often you want to look at these and set up systems that prompt you to check these and other Google Search Console metrics in a systematic, analytical method each month.
While you check out your Googlebot Crawl Stats, I’ll write Part 4 in this series that will talk about how to know which URLs you should focus on for technical SEO improvements and in particular, Core Web Vitals metrics.
Dig deeper
This is the third article in a series recapping my SMX Advanced presentation on how to turn SEO metrics into action items. Below are links to the first two articles:
- Evaluating technical SEO data: Key segmentation approaches
- Key Google Search Console metrics to monitor every month
Courtesy of Search Engine Land: News & Info About SEO, PPC, SEM, Search Engines & Search Marketing
Category seo news | Tags:
Social Networks : Technorati, Stumble it!, Digg, de.licio.us, Yahoo, reddit, Blogmarks, Google, Magnolia.
You can follow any responses to this entry through the RSS 2.0 feed.


