Archive for the ‘seo news’ Category
Tuesday, July 19th, 2022
Just a friendly reminder that as of June 30, creating new or editing existing ETAs is no longer a possibility. You can review the announcement from Google here.
PPCGreg brought up an issue to Google Ads liaison Ginny Marvin on Twitter yesterday about not being able to fix a “Destination not working” on an ETA and received this response:
Final URLs in ETA’s can no longer be edited, but if the site/URL experienced an issue that caused the “destination not working” disapproval, you should be able to go through the standard manual appeal process once the URL is back working as intended.
— AdsLiaison (@adsliaison) July 18, 2022
ETA’s will continue to serve. You won’t be able to edit ETAs, including the URL. If you run into an issue where the destination isn’t working, you should probably remove the ad, or switch to RSA’s. Alternatively, as Marvin points out, you can wait until the URL is working again.
Why we (still) care. If you decide to leave your ETAs on, be sure to keep a close eye on them. It wouldn’t surprise us if more ETAs start getting disapproved in a last-ditch effort by Google to get everyone to switch over.
The post Reminder – you can no longer create or edit ETAs appeared first on Search Engine Land.
Courtesy of Search Engine Land: News & Info About SEO, PPC, SEM, Search Engines & Search Marketing
Tuesday, July 19th, 2022
Consumer privacy regulation and the death of the third-party cookie are impacting virtually every industry and every facet of the digital marketing and advertising ecosystem.
While the push for privacy is forcing companies to rethink how they collect and utilize data to orchestrate customer experiences, it’s also opening up new opportunities to differentiate their brand and transform their relationships with customers.
The companies that will thrive on the other side of this seismic shift aren’t taking a passive, “wait-and-see” approach. They’re executing against a third-party data deprecation playbook right now.
Download this e-book to learn how you can successfully navigate the ongoing changes in the privacy-first era. You’ll discover:
- The four tools you need in your third-party data deprecation playbook.
- How a customer data platform (CDP) enables you to execute the playbook.
- What companies like VF Corporation, HEINEKEN USA, and others are doing to make the transition now.
Download Now
The post The third-party data deprecation playbook appeared first on Search Engine Land.
Courtesy of Search Engine Land: News & Info About SEO, PPC, SEM, Search Engines & Search Marketing
Monday, July 18th, 2022
Classifying queries based on the classic search intents is no longer as effective as it used to be.
Today, SEOs who want to understand search intent should be closely analyzing micro intents.
This article will discuss 12 different types of micro intents that will help you better understand what types of content you should be creating.
Google’s focus on recognizing the search intent
When I first saw the Quality Rater Guidelines in 2011, I was struck by the recurring reference to search intent.
Google clearly indicates in the guidelines that search evaluators must first understand the search intent behind a keyword before proceeding to evaluate search results.
“Understanding the query is the first step in evaluating the task. If you don’t understand the query or user intent, do web research using the Google search engine or an online dictionary or encyclopedia. If you still don’t understand the query or user intent, please release the task.”
Google’s core updates suggest that, in addition to E-A-T, Google is also focusing on recognizing the search intent and the corresponding matching with the content in order to improve the user experience with the SERPs.
Google is getting better at interpreting search queries and their intent, which makes a more detailed SERP analysis necessary.
The classic search intents
In classic search marketing, keyword are broken down into these categories:
- Informational
- Transactional
- Commercial
- Navigational
- Brand
Transactional and commercial can be combined, as both are similar in terms of user intent.
Google itself classifies the keyword types in its quality rater guidelines according to
- Do = Transactional
- Know = Informational
- Go = Navigational
In 2015, Google also introduced another class to the Know keywords with Know Simple.
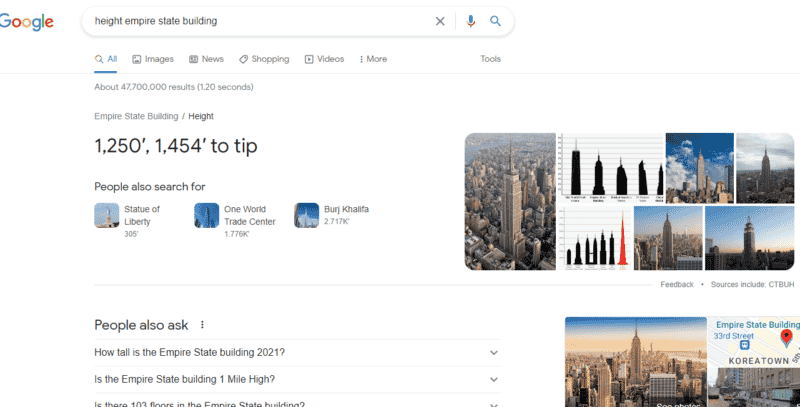
For simple search queries, Google delivers a OneBox to deliver an answer directly in the SERPs. Typical use cases for the delivery of a OneBox are:
- Calculators
- Weather
- Time
- Translation
- Specific attributes of an entity
Here is an example for the search query [height empire state building]:
With the search intentions mentioned so far, however, two important differentiating features are still missing. Namely, the need for topicality and regionality. Therefore, it makes sense to add:
- Trending keywords
- Regional keywords
I won’t dive deeper into classic search intentions, because there are plenty of great articles on this topic.
What are micro intents?
The concept of micro intents describes sub-forms of the classic search intents or user intents (transactional, navigational and informational).
The determination of micro intents by analyzing the SERPs allows the derivation of certain types of content that users expect for a search term.
Micro Intents for a better understanding of the search intent
From the experience of hundreds of SERP analyses in the last 10 years, the following content properties and derived micro intents have emerged:
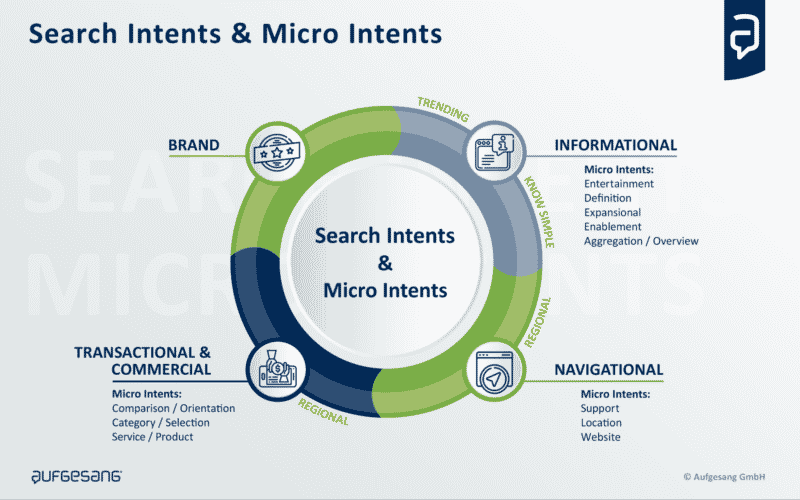 Overview: Search Intents and Micro Intents
Informational Micro Intents
Micro intents for an information-oriented search can be:
- Entertainment: People want to pass the time and are looking for entertainment. The entertainment can be satisfied with short snackable content such as memes or short video clips, which are usually consumed directly on the respective social media platform (social content) and shared.
- Definition: Users looking for basic answers (e.g. to the question What is…? Which does ______________ mean …? How important …?) first want to understand what something means in order to open up the context of a topic and/or to decide whether it makes sense to delve deeper into a topic. They are beginners. Wikipedia articles are a typical example of content that fits this micro intent. Google sometimes tries to answer this search intent with answers directly in the SERPs (e.g. featured snippets)
- Expansional: Users who want to delve deeper into a topic in their online research need detailed content that sheds light on as many perspectives as possible. The content should comprehensively describe a topic and answer several questions. The so-called holistic landing pages or pillar pages are a sensible approach to serve this search intent. Here, the depth and scope of the content plays a special role, but also new perspectives that have not been published often.
- Enablement: Users who want to empower themselves to do something need specific guidance. Content that is intended to serve this search intent should answer the How do I…? questions step by step.
- Aggregation/overview: Similar to the expansional search intent, the user is concerned with getting a neutral overview of a topic. However, the content should be kept as short and clear as possible (e.g., in the form of tables, thematic or random listicles).
Transactional/commercial micro intents
Micro intents for a transaction-oriented search intent can be:
- Comparison / orientation: The user is on the way to buying a product service or at least shows interest in investing. In order to get an overview, he looks for the best solution. Ranked listicles, tests or comparisons make sense for this search intent.
- Category / selection: With this search intent, there is a specific interest in products and services. The user knows roughly which solution is the right one for him, but is not yet sure which variant of a service or product group is the right one. Classic shop category pages or service overview pages are ideal for this search intent. The products and/or services should be the focus of the main content (MC), possibly accompanied by information to simplify the decision for a variant.
- Service / Product: The user knows pretty much exactly what he wants or which solution is the right one for him. He is about to make an inquiry/order and would like to find out more about the properties, price, delivery, delivery costs, guarantees … in detail. Service detail pages and product detail pages make sense to serve this search intent.
- Brand: In addition to the classic search intent brand, another micro intent can be added. This takes into account the user’s need to find out more about the brand or provider in order to build trust. Typical types of content here are testimonials, customer testimonials, field reports…
Navigational Micro Intents
- Support: The user requires service content for the use of an ordered product. Instructions for use and product-related FAQs make sense here as content.
- Location: the user wants to find a location near or in a place with the intent to visit it.
- Website: The user wants to navigate to a specific area of a website.
More to read about the concept of micro intents here.
Micro Intent by Verbs
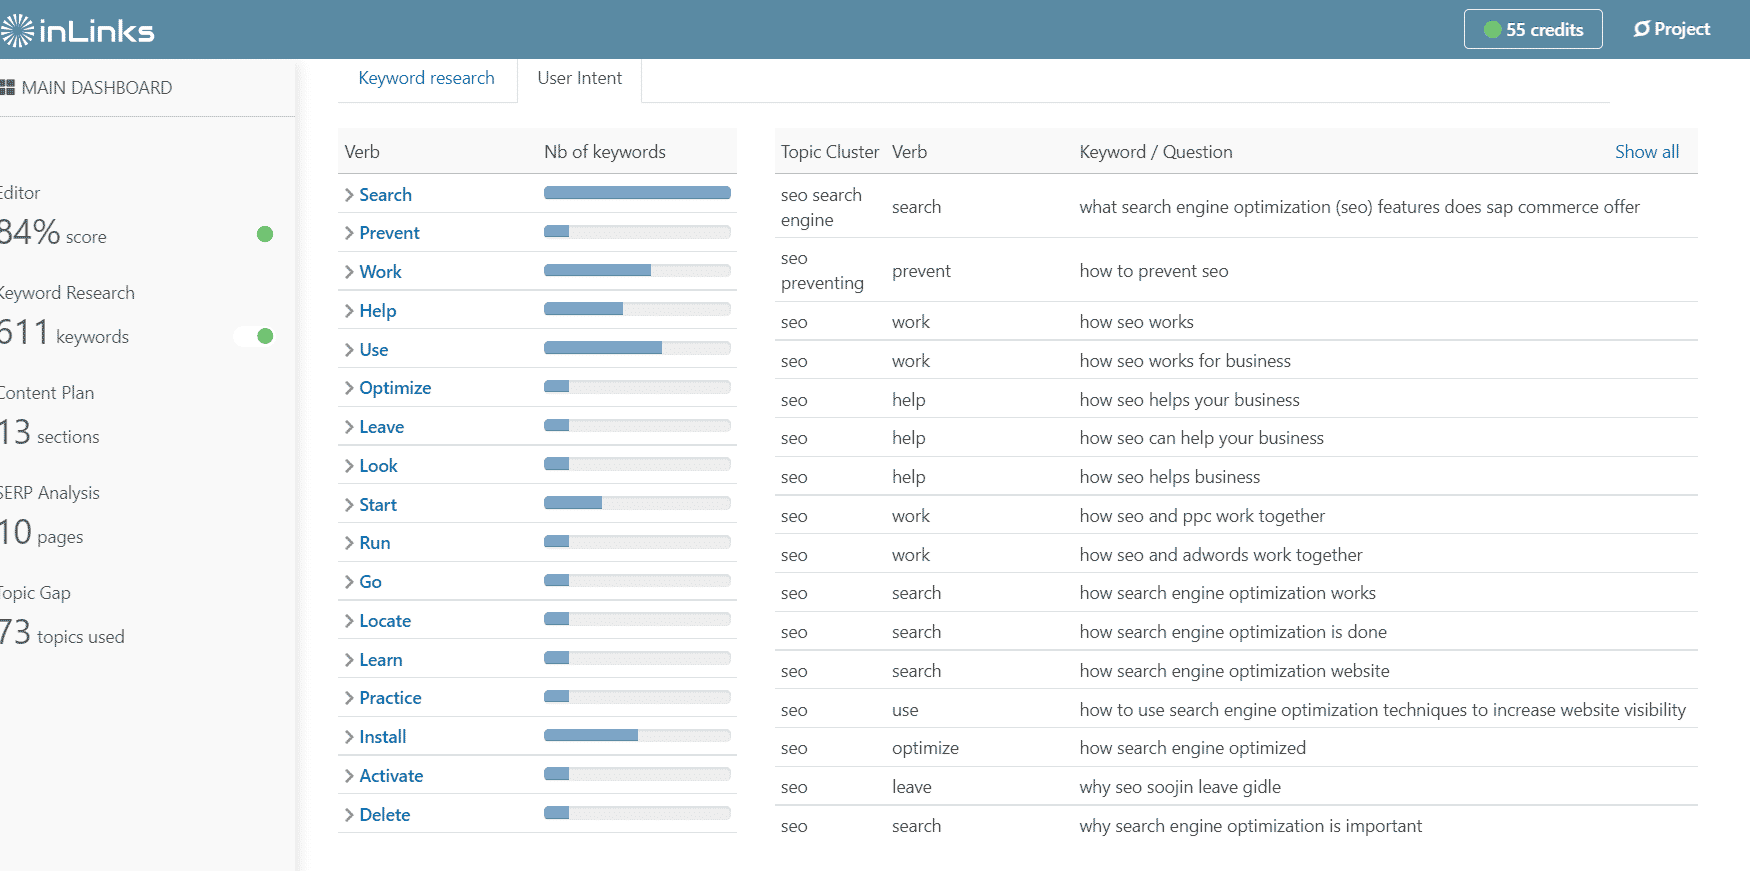
Another smart approach to the detailed classification of search intents can be found at Inlinks. When classifying the search intent, the team around Dixon Jones uses the verbs used in the context of the keyword/topic as a guide.
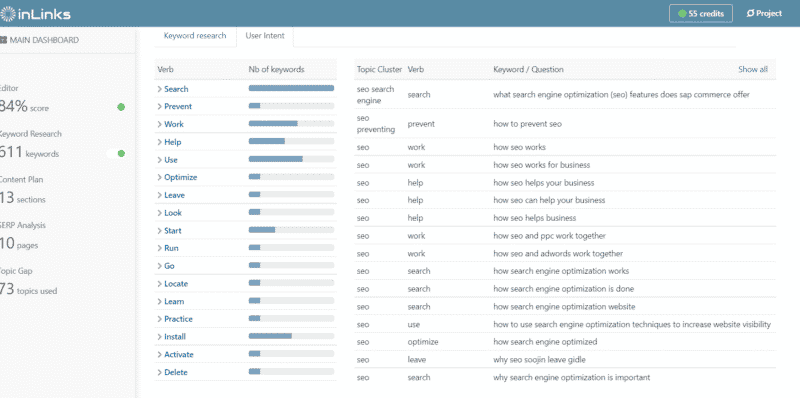 InLinks User Intent by verbs for the keyword “seo”
The types of search intent in the customer journey
In the research process for solutions, products, offers … search queries often follow a specific sequence.
Depending on the phase in which the searcher finds himself, he wants information, then solutions, and finally certain products to buy.
Here, the search intent types play a role, which can theoretically be arranged in a certain sequence.
A trigger ensures that a user enters a research process, which can begin at different stages of the customer journey depending on the level of knowledge.
Google describes this process in the “Messy Middle” as alternating between exploration and evaluation, before making a purchase.
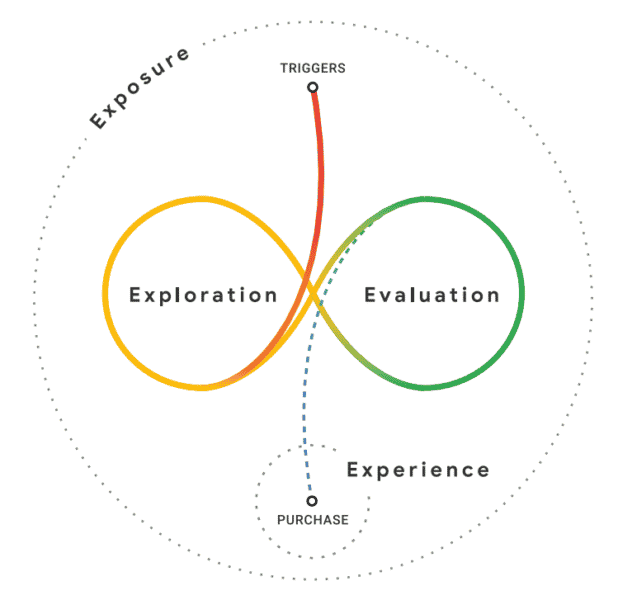 From Google’s Decoding Decisions: Making sense of the messy middle
Not every search process follows the same pattern.
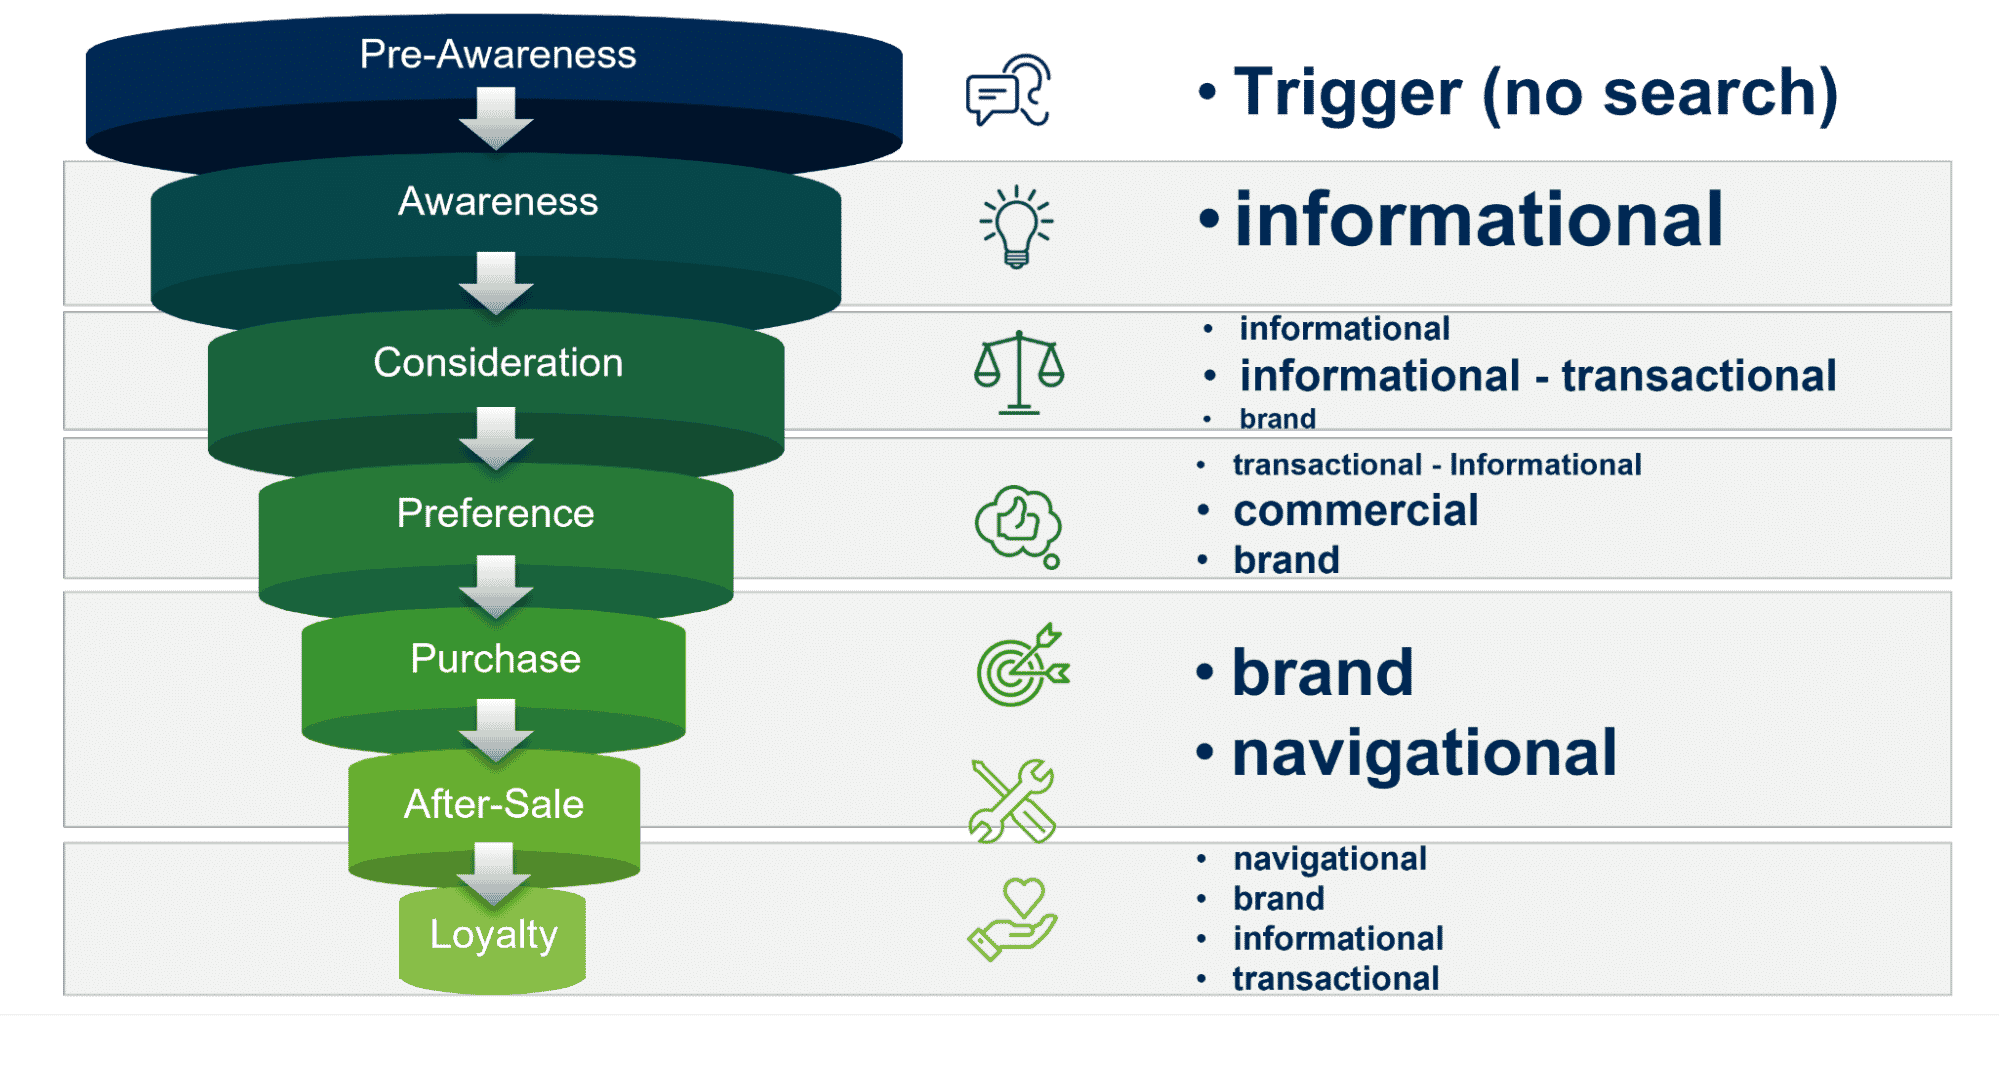
Depending on the offer or product, these search sequences can run differently within the customer journey. The following is a sample search sequence by keyword type:
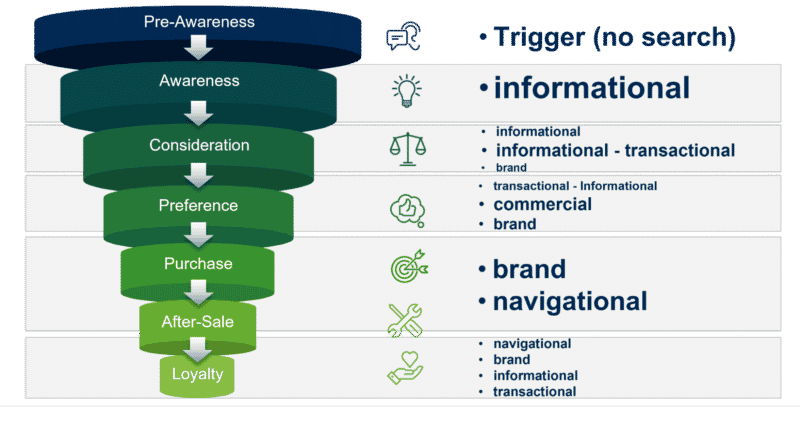
In the Pre-Awareness phase, a trigger is necessary to lead a user into a search journey. Then, depending on the level of knowledge, the user will work his way through informational, transactional, and commercial to conversion, or directly enter the preference phase via commercial search queries.
Brand and navigational terms play a role from consideration to the end of the customer journey.
Map content types into the customer journey according to micro intents
Mapping content types to the customer journey isn’t easy. It makes more sense to include user micro intents in content journey mapping.
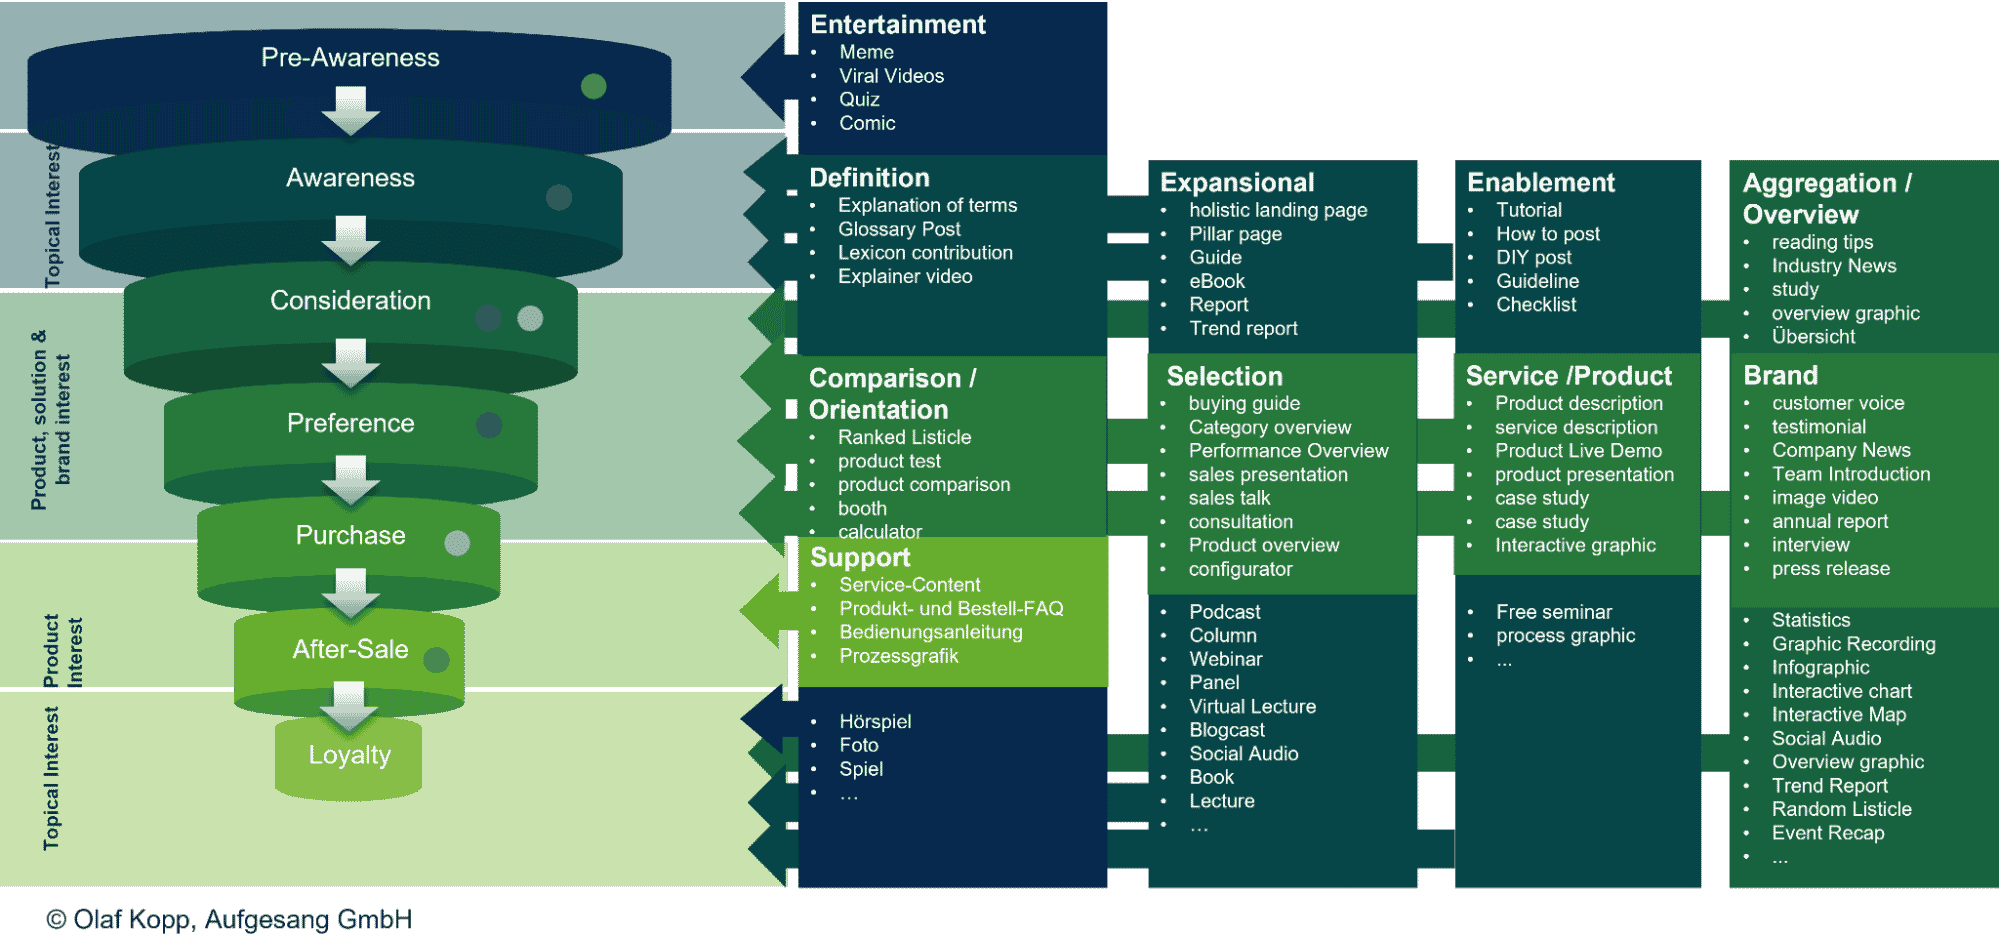
In the following overview graphic, I have grouped the content types according to micro intents.
Again, there are types of content that can be used to satisfy multiple micro intents. The following overview is only intended to explain the principle, but only contains selected typical types of content. A more complete grouping then follows in the next few chapters, broken down by customer journey phase.
Below I have grouped different types of content according to the customer journey phases. In the end, however, it is not the type of content that determines the customer journey phase, but the topic itself or the micro intent that the content should fulfill.
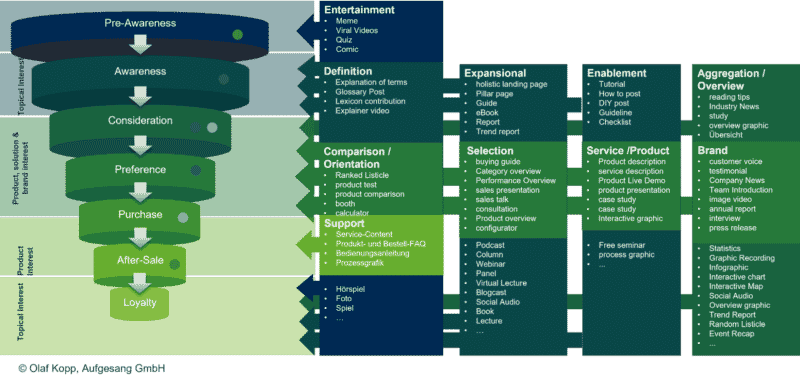
Content types in the pre-awareness phase
In the Pre-Awareness phase, content must be proactively distributed to the user, as the user himself has no proactive interest in a particular topic or need.
In other words, emotional content that generates reach. Possible psychological triggers can be: fear, fun, surprise, indignation or lust.
The topics can be diverse.
Possible content types can include:
- Viral videos
- Memes
- Education
- Entertainment events
- Games
- Comics
- Riddles
- Reports and reports
- Psychological tests
- Polls
- Social media stories
- Columns
- Sweepstakes
Content types in the awareness and consideration phases
In the awareness phase, the user actively searches for topics about which he would like to find out more. He or she is actively researching a topic related to the offer or is already doing so.
As a shop for running shoes, you could offer content related to the topic of losing weight and health, such as nutrition tips or fitness guides.
Possible content types can include:
- Podcasts
- Calculator
- Advisory
- Interviews
- Webinars
- texts
- Instructions
- Checklists
- Guides
- Specialist articles
- Studies
In the consideration phase, the user shows an initial interest in or need for solutions, which can include their own products.
With the “Around-the-Product-Content” one should take care to keep the information neutral. Here the content acts as a “solution-finding consultant”.
The shop for running shoes should emphasize the advantages of jogging for the goal of losing weight, but also point out other areas such as nutrition, in order to then present an overview of the best running shoes or a running shoe configurator in the next step.
Possible content types can include:
- Product tests and comparisons
- Solution overviews and lists
- Configurators
- How to find … guides
- Advertorials
- Workshops
Content types in the preference and purchase phase
In the preference phase, the user shows specific interest or need for products and offers to which your own products belong. Here the “About-the-Product-Content” acts as a “purchase advisor” and the previous information neutrality can be lifted.
The content on the shop category and product detail pages is important for the running shoe shop.
Possible content types can include:
- Product texts
- Product and material
- Manufacturer
- Case studies
- Buying guides
In the preference phase, the user determines a narrower circle of possible suppliers (relevant set). That is why it is also important at this point to communicate the core story directly (“about the brand content”).
Possible content types can include:
- Company profile
- Videos
- Reports on social and ecological commitment
- Awards
- Case studies
- Customer testimonials
- Reviews
In the purchase phase, the user has decided to order the product or offer from a provider or is in the contractual phase final talks.
In this phase, he needs information about the purchase process by means of “about-the-process-content.”
Possible types of content can include:
- FAQs
- Terms
- Explanations of the ordering
- Payment
Types of content in the after-sales and loyalty phase
In the after-sales phase, the user again needs “about-the-process” and “about-the-product-content.” But this time to the further process of ordering and using the product.
For the running shoe shop, this could be the order confirmation and care instructions for the shoe.
Possible content types for the after-sale phase can include:
- Order confirmation
- Delivery status
- Information on the first steps or kick-off
- Use
- Operating instructions
- Care instructions
- Installation or assembly instructions
In the loyalty phase, the user again needs the same content types as in the awareness and pre-awareness phase – tailored to his previous interests and preferences. The goal of the content of the loyalty phase is to turn the customer into a repeat buyer and/or loyal supporter.
11 key insights about micro intents
- Content formats can/should be used multiple times for one type of content. In this way, synergy effects can be used and the different consumption preferences of the target groups can be taken into account.
- SERP analysis, keyword research, surveys or discussions with the target group should help identify the appropriate content formats based on consumer preferences.
- Certain types and formats of content perform differently at different stages of the customer journey.
- The consumption habits for content differ according to industry, target groups, personas and context (e.g., place of consumption or end device used).
- The classification according to the classic search intents transactional and informational is often not sufficient to derive clear recommendations for the content to be created. Therefore, the classification according to micro intents makes more sense.
- In the first two phases, pre-awareness and awareness, “around-the-user content” makes sense. This is content that does not deal with the offer or the product, but with the topics of the users beyond that.
- From the consideration phase, the user’s interest in solutions and products increases. In the consideration phase, they are often still undecided as to which solution is best for them. There he needs to get an objective overview of possible solutions.
- In the preference phase, he is already one step further. He has focused on one or more solutions and created a relevant set of potential providers for the solution(s).
- In the purchase phase, he decided on a provider and wants to conclude the contract quickly and easily.
- In the after-sales phase, he makes the first positive and negative experiences with the offer and needs it. if necessary, support during commissioning, optimal use or the return.
- In the loyalty phase, the game starts again from the beginning and he may want more information about topics and offers.
The post How to use 12 micro intents for SEO and content journey mapping appeared first on Search Engine Land.
Courtesy of Search Engine Land: News & Info About SEO, PPC, SEM, Search Engines & Search Marketing
Monday, July 18th, 2022
You’ve landed a new client and you’re digging into the website. One look tells you this is not going to be easy.
Sure, you could do some SEO activities to make the client happy. But there’s bigger fish to fry.
The information is out of date, it’s not well written and the formatting is hard to read. The website looks old and the CMS is clunky.
The client has big expectations of your SEO program. What do you do?
There’s an old saying about putting lipstick on a pig. Sure, you can “do some SEO.” But you and I both know that we need to address the fundamental problems if we want to succeed in SEO and rank on Page 1 out of millions of results.
At this point, you need to get real with the client. This can be a hard conversation; what if they don’t have the budget for what you are proposing?
You have to prepare to walk away from the project or else get creative with the budget. Because neither one of you will win if you don’t get it right.
That said, there are two major categories you need to fix in any website before you kick an SEO program into high gear:
- The content on the website
- The technical back-end of the website
I’ll touch on what to look for in each category next.
Updating the content
A common lipstick-on-a-pig mistake is when a client asks for more and more new content and fails to address the content they already have on the website. I encourage clients to divert equal resources to updating their old content in addition to creating new.
How often to update the content on a website depends on the topic. In general, there are three things to consider:
- If the topic is evergreen. Some topics are evergreen, meaning the information can stay relevant for a long time. Of course, that doesn’t mean you can’t tweak and optimize evergreen pages for best results. It simply means that there will likely be less work.
- If the query deserves freshness. You will need the most up-to-date content for a website if it is targeting queries or keywords that require the freshest content in the search results. A social or political event is one example. Google discusses that here.
- If the topic is deemed “your money or your life” (YMYL). Google discusses YMYL topics in its Search Quality Rater guidelines (think financial or medical advice) and holds webpages that contain them to a higher standard.
In addition to updating the content itself, websites need a strategy for how they will organize the content to get the most SEO value from it — and to create a better user experience.
This includes things like the navigation and how you link pages internally. SEO siloing and internal linking best practices are foundational SEO strategies that will streamline your SEO program’s efforts if done well early on.
Updating the website
At first glance, does the website look trustworthy? Or does it have an outdated look and feel? What about the performance of the website — does it provide a good user experience?
These are the fundamentals we must get right before driving more traffic to a website.
Some things to work on right away include:
- Spider-friendly code: The website needs clean, streamlined code the search engine spiders can crawl with ease.
- The content management system: That custom CMS the client built may have been great at first, but it has SEO problems, and you can’t easily update things inside it. There’s a reason why WordPress is the most popular content management system because it is always up to date.
- Site speed: How fast a webpage loads impacts the user experience, which is why it’s a part of Google’s ranking algorithm.
- Mobile usability: Most websites have a large number of people visiting from a mobile device. Websites need to be responsive to desktop and mobile users.
- Robots.txt: Robots.txt can block unnecessary crawling to reduce the strain on a server and help bots more efficiently find good content.
- XML sitemaps: It’s a best practice to tell search engines about the pages, images and videos on a website with an XML sitemap.
- 301 redirects: 301s prevent error pages by redirecting old pages to newer, more relevant content as needed. This can improve user experience.
- Fully qualified URLs: When you link internally and include the full URL starting with the “https:” instead of a relative URL it can fix certain crawl issues.
- Canonical tags: The canonical link element tells search engines which version of a URL you want in the search results and can resolve duplicate content issues.
- Server maintenance: Server diagnostic reports help you address common errors right away to improve the user experience.
- Plugins: For security reasons, update all plugins.
- The design: Make sure the web design/user interface is in keeping with modern functionality and trends. Usually, an update every three to five years works.
Of course, there are more ways to address the technical aspects of a website, but this is the minimum to give an old website some new life. For more, an SEO checklist can help.
Just say “no” to pigs
I believe as SEO professionals, we have a duty to advise potential clients in a way that sets them up for success.
If we know that what the client is asking for is merely putting lipstick on a pig, then we need to be upfront about it. Cosmetic changes can add curb appeal, and may be needed — but don’t let the work stop there if the site is still just a pig.
SEOs must go beyond the lipstick and help create a good user experience to succeed. Updated content, Core Web Vitals, and especially page speed are examples of how SEO changes the pig into something better.
And, we should be prepared to either walk away from a potential client who does not want to follow our advice, or get creative and know how to make the most impact with their budget.
That may mean you address the fundamental problems of the website bit by bit on a slower timeline before kicking it into high gear. It’s not the job of SEO to make a pig fly … it’s the job of SEO to transform a website so that it becomes an eagle.
The post Putting lipstick on a pig: Fix the website or fail at SEO appeared first on Search Engine Land.
Courtesy of Search Engine Land: News & Info About SEO, PPC, SEM, Search Engines & Search Marketing
Saturday, July 16th, 2022
Google has confirmed that it is having indexing issues indexing new content and displaying that content in Google Search and on Google News. The issue started sometime before 7 am ET today, as I first reported prior to Google’s confirmation on the Search Engine Roundtable.
Google’s confirmation. Google confirmed this on Twitter saying “There’s an ongoing issue with indexing in Google Search that’s affecting a large number of sites. Sites may experience delayed indexing. We’re working on identifying the root cause. Next update will be within 12 hours.”
Timeline. So far, we know Google has been having issues indexing new content prior to 7 am ET today, July 15, 2022. Google confirmed the issue at about 10:50 am ET on July 15, 2022. At around 3 pm ET today, Google said they found the issue and is now working on a fix. Google wrote “We’ve identified the issue with indexing and we’re working on a fix. Next update will be within 12 hours.”
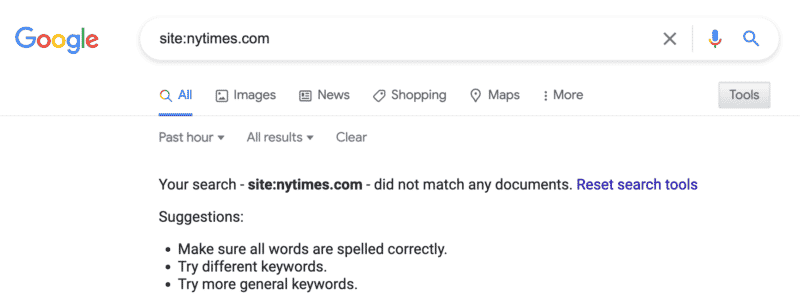
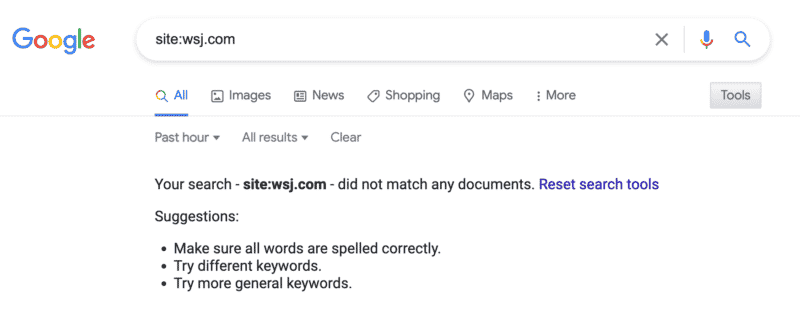
What is the issue. The issue is that Google is not indexing new content from sites published across the web. That includes new content on news sites, like this one, or the New York Times, Wall Street Journal or any new content across the web. Google does seem to be crawling this new content but simply not indexing the new content, preventing Google Search from showing those results in Google Search or Google News.
Here are some screenshots showing the site command restricted to the past hour, not showing content on news sites that post content all the time:
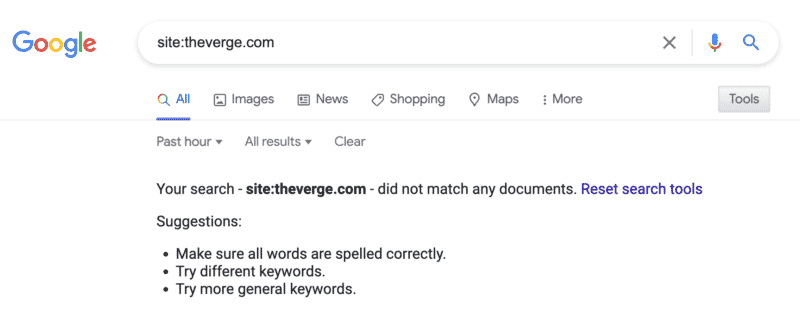
Why we care. If you are a news publisher, breaking news stories, and that content is not being indexed that means you are not going to be seen in Google Search or Google News for those stories. If you are a searcher and looking for new content, you won’t really find that content on Google Search or Google News.
To make things worse, Google Analytics 4 real-time traffic reporting seems to be buggy this morning and not showing full traffic data.
This likely will impact your site’s traffic for any new content that you have published this morning.
Google is working on a fix and we hope they resolve the issue soon.
The post Google confirmed indexing issue affecting a large number of sites appeared first on Search Engine Land.
Courtesy of Search Engine Land: News & Info About SEO, PPC, SEM, Search Engines & Search Marketing
Saturday, July 16th, 2022

Of all the tactics for driving traffic on the web, search engine optimization (SEO) is among the most powerful. According to a BrightEdge study, 53% of a website’s traffic can typically be attributed to organic search. For e-commerce companies, SEO is even more important, with search generating 65% of website traffic and 67% of website revenue on a last-click basis, according to an analysis by Wolfgang Digital.
This phenomenal return, combined with the increasing complexity of the SEO environment, is why marketers turn to SEO platforms to gather the data and insights they need to identify appropriate tactics, set priorities, and even implement solutions directly.
MarTech’s “Enterprise SEO Platforms: A Marketer’s Guide” examines the market for SEO platforms and the considerations involved in implementation. This report reviews the latest trends and includes profiles of leading vendors, pricing information, capabilities comparisons, and recommended steps for evaluating and purchasing.
Visit Digital Marketing Depot to get your copy.
The post Compare 15 leading SEO software vendors appeared first on Search Engine Land.
Courtesy of Search Engine Land: News & Info About SEO, PPC, SEM, Search Engines & Search Marketing
Saturday, July 16th, 2022
On Twitter, Yael Consulting founder Lior Krolewicz noticed a strange issue where Google isn’t reporting the correct ad spend. We checked the Google Ads status dashboard and it looks like this is a known issue.
What Google says. There is no word on when the issue will be resolved. Be sure to check the dashboard for updates.
There's an ongoing issue affecting Google ads products and Google Analytics for a large number of accounts. We're working on addressing the issue. Please see the dashboard for updates: https://t.co/F19BfFAJ8F
— AdsLiaison (@adsliaison) July 15, 2022
Why we care. Incorrect reporting gives way to incorrect adjustments, optimization, and changes. Check your ads dashboard. If your numbers look incorrect, you may want to hold off on making any big changes until the issue has been resolved.
The post Google Ads, Analytics issue affecting reporting stats appeared first on Search Engine Land.
Courtesy of Search Engine Land: News & Info About SEO, PPC, SEM, Search Engines & Search Marketing
Saturday, July 16th, 2022
Instagram is continuing to test its Subscription option and has just added three new features for users in the beta group.
Earlier this year. Meta began testing Instagram Subscriptionsin January with a small group of influencers. Today the same features are available to “tens of thousands” of creators in the US.
Three new features. The features that are now available are:
- Subscriber chats, powered by messenger and disappear after 24 hours
- Exclusive posts or reels
- A separate subscriber-only tab on their profile where subscribers can access exclusive content
What Instagram says. “A really important thing to creators everywhere is sustainable income. At the end of the day, if you’re a creator, you’re a business, and a great way to establish some sustainable and predictable income is through Subscriptions,” says Head of Instagram Adam Mosseri. You can view his announcement on the app here.
Why we care. Though this isn’t an ad feature, individual brands that use Instagram to promote their content may benefit from subscriber-only features. This option is likely Meta’s way of competing with TikTok and Snapchat to drive more creators to it’s platform.
The post Instagram Subscriptions test adds 3 new features appeared first on Search Engine Land.
Courtesy of Search Engine Land: News & Info About SEO, PPC, SEM, Search Engines & Search Marketing
Thursday, July 14th, 2022
There are numerous ways to measure paid search and its contributions across channels. Your PPC strategies can guide specific user behaviors, and in turn, change how you measure attribution and cross-channel lift within your marketing mix. In this session at SMX Advanced 2022, Alyssa Altman and Andy Orlando discuss the role of paid search in attribution. They’ll go over:
- Paid search and attribution
- The marketing funnel and paid search types
- Campaign types and their contribution
- The importance of data modeling
- Creating your attribution toolkit
- Analysis examples and model comparison tools
- Picking your model
- Insights and tips
Paid search and attribution
Paid search is a critical piece of the attribution modeling puzzle, with over 8.5 billion searches a day happening in Google. But not all searches are created equal. People tend to search using terms that indicate where they are in the buying funnel. Whether that’s intent to purchase or perform competitor research. Considering the attribution model, those searches are assigned a certain weight, which can become complicated.
The marketing funnel and paid search types
Orlando goes on to explain that the top of the funnel is where awareness happens. Non-branded searches are typically here. The point is to increase brand awareness and target visitors to your website. The next step is where interest and consideration come into play. The bottom of the funnel is where the commitment and conversion happen. Brand search and Performance Max campaigns target bottom of funnel buyers by finding targeting those searchers who are ready to buy.
Campaign types and their contribution
The four campaign types that target buyers ready to convert are:
- Brand
- Non-brand
- Conquesting
- Remarketing
Upper and middle funnel tactics such as social display and unbranded search tend to lay the groundwork in preparing users for a conversion. These tactics factor heavily early in the conversion journey but do not directly lead to a conversion. They tend to be undervalued as a contributing conversion factor. Orlando explains that although display, unbranded search, and remarketing contribute some, it’s essentially branded searches that attribute the most.
The display, unbranded search, and remarketing tactics can be seen as the “forgotten workers” that fill the conversion funnel and set the stage for the hero “branded search” to sweep in and close the deal. And since they’re lower in the funnel branded search, brand searches ended up generating more last click conversions and thus tend to be overvalued in traditional attribution models such as Last Click. So branded search looks like the hero comes in and saves the day and the upper funnel package tends to be kind of forgotten.

Attribution challenges
Altman explains that a lot of the challenges around attribution have to do with the fact that there are different models within the different platforms. Google has more options available for advertisers within the platform and Analytics, whereas Microsoft has a lot less. So even if you are attempting to use the same model across channels, issues can arise.
Another issue is multiple channels trying to take credit for the sale or lead. Altman points out that each channel may be correct in wanting to take credit, but when overreporting happens, it can be frustrating for the advertiser to sort out. Humans view different types of content across different channels and they make a decision somewhere along the funnel where an advertiser has placed an ad. It will essentially be up to the advertiser to place the credit.

Attribution model comparison tools
Google Analytics is arguably the most popular option for comparing attribution models. If you’re using Google Analytics, you’ll be able to compare the different models and look at all media coming in (if tagged properly). Altman suggests using UTM parameters to ensure conversions are being tagged properly. GA lets you compare the different models before you make a decision on which one you want to use.
The Top Conversions Path Report in the Multi-Channel Funnel section is an undervalued report, says Altman. This view provides insight into what interactions a user had until they converted. It can determine how valuable each interaction is for modeling.


Altman goes on to review the most popular attribution models and their advantages and disadvantages. These are available to advertisers in Google Analytics.
Data modeling and data-driven attribution
Orlando explains that having a data-driven attribution model can help marketers optimize, in real-time, across the conversion journey. Machine learning and AI are used to assign attribution across the conversion journey. Microsoft As calls this “As it Happens” attribution modeling, which is essentially Google’s “Last Click.”
Create an attribution toolkit
Altman suggests the following tips when creating your attribution toolkit:
- Collect data on your audience
- Begin creating and testing
- An arsenal of tools to help you perform a deeper analysis
- Utilize Google tools such as Analytics multi-funnel reports and path reports, and attribution model comparisons
- Land on the attribution model for your organization or business segment
- Use third-party tools
- Use zoomed-in attribution models within the platforms such as Data-Driven attribution in google ads to optimize in-platform
Attribution model recommendations for paid search
Altman suggests that if you’re running brand awareness campaigns through Google ads and other platforms, you may want to look at First-Click attribution. If your campaigns are a mix of brand awareness and mid and lower-funnel advertising, you might want to go with Linear attribution because it distributes the credit for the conversion equally across all of those paths. And if you’re running a lot of media and multiple channels, both digital and traditional, you might want to look at that last non-direct click.
Additional tips
For more details and additional tips and tricks from Altman and Orlando to ensure you’re using the correct attribution model for your ads, get your free pass here.
Already registered for SMX Advanced? Log in.
The post The state of attribution modeling in paid search appeared first on Search Engine Land.
Courtesy of Search Engine Land: News & Info About SEO, PPC, SEM, Search Engines & Search Marketing
Thursday, July 14th, 2022
Google has announced a new way to create ads. The Ads Creative Studio was officially launched after a beta last year and is now available globally.
Ad customization is possible. In the ACS, advertisers or creators can create multiple versions of a single display or video ad. The ads can be customized for different audiences, locations, languages, or contexts.
How does it work. To make the changes, creators select the changes they want to make and provide the different versions of that particular element based on the rules you set.
The feature is now available for video and will soon be launched for display as well.
Seamless workflows. Google is now allowing advertisers to export images from the ACS asset library to the Google Ads asset library of any linked account. This means that when you’re assembling creatives for display or Performance Max campaigns, you’ll be able to easily find the images you want to use.
Another newly released feature is the ability to connect the ACS account to Campaign Manager 360. Previously the ACS was available to those advertisers in beta, but starting today it becomes available for everyone to upload, manage, and export HTML5 creatives. Google says that video exports will also be available “soon.”
Early testing and results. The feature was available to PepsiCo who wanted to use it to reach audiences in different contexts such as house parties, BBQs, and sporting events. The creative team at PepsiCo used ACS to customize their ads at the relevant audiences and found the results to be “smoother and more efficient and, with a single tool, the team was able to standardize processes across functions.” PepsiCo and Google did not share numbers or specific stats related to performance, however.
General Motors South America wanted to boost brand awareness of the Cruze 5 model. The brand decided to customize beyond the basics and needed to produce 14 unique ads without sacrificing time, budget or resources. Using Ads Creative Studio, the brand reduced costs by 30% and the campaign saw a 56% increase in Google searches for “Chevrolet Cruze” and a reduction in cost per view of 32% compared to the industry benchmark.
Learn more about Ads Creative Studio. You can read the announcement from Google here.
Why we care. ACS will be an interesting feature for advertisers to test. If you’re running campaigns aimed at multiple audiences, the ACS seems like a helpful tool to quickly manage and make dynamic changes to video ads when you’re trying to reach multiple demographics, without creating additional campaigns or ad types. While we haven’t tried ACS ourselves, we’ll be interested to see how this works in comparison to just creating new ad sets.
The post Google launches Ad Creative Studio to customize video and display ads appeared first on Search Engine Land.
Courtesy of Search Engine Land: News & Info About SEO, PPC, SEM, Search Engines & Search Marketing